Commentary
Analysis: ‘Big 4’ Revised STB Service Recovery Plans
Written by Jim Blaze, Contributing Editor
The four largest U.S. freight railroad companies—BNSF, CSX, Norfolk Southern, Union Pacific—all reported, per the request of the Surface Transportation Board, supplemental information about their efforts to improve service and network fluidity. This is, of course part, of an ongoing STB service investigation with public hearings held back on April 26 and 27 of this year.
Each letter and accompanying exhibits is different. And in some cases, the way each railroad has calculated its data reporting reflects different operating assumptions and metrics by the respective rail managers. Therefore, direct comparison and contrast as to how each railroad companies’ “recovery” is proceeding is hard to assess at a technical business level.
Each company continues to advocate that it has a sound recovery plan. Yet, the takeaway message is that none of the companies sees an immediate or easy path ahead. This is particularly the case with improving its available labor pool.
Six months or longer seems to be a prudent recovery period for having a sufficient labor pool available to smooth out train crew shortages. Bringing back locomotive fleet size is less of a problem, since the railroads mostly seem to have available “stored” locomotives that with mechanical preparation could be returned to service operational condition in a reasonably short amount of time. Or, the fleets can be supplemented with rental units from locomotive leasing companies.
From their submitted filings, no one seems to be ordering new freight locomotives from the two largest builders, Wabtec or Progress Rail.
Here is summary of some of the service performance supplemental data as presented in their individual document filings. The metrics covered are ones I’ve selected, as an experienced strategic railroad economist, as being important to our railroad readers. Those seeking additional commercial background are encouraged to read the filings.
Overall Strategic Conclusions
Each of the four carrier’s senior managers seems to signal a different level of confidence as to their operational business model.
Three of the four seem to continue their respective commitment to the principles of the badly worded “Precision” Scheduled Railroading model—which, from their own data, clearly is nowhere near a delivered scheduled precision. Frankly, the term is embarrassing.
BNSF seems to avoid entirely a reference to the PSR definitions in its filing.
Of the four, the takeaway is that BNSF is serious about resetting its operation and making quite a few changes to its service model. That starts with a rarely used embargo of inbound freight bound for southern California. BNSF’s filing is full of rich background data graphs that acknowledge the challenges that built up over the past three years.
Union Pacific is a bit more reserved in its diagnostics of the PSR model and appears to be sticking to the principles and practices while focused on the shortage of labor. For now, there is no geographic restriction. But there are various initiatives to have customers cut back on their moving railcar inventory as UP tries to manage against a metric it define as carloads of demand per carload of market supply. That’s a term no one else seems to use.
Norfolk Southern seems to be making a considerable change to its internal procedures for operational control with an introduction of a new model. Actually, it is what NS perceives as a next evolution stage of a previous day-to-day operational systems control model. That switchover date will happen soon. Yes, it’s still based upon NS’s definition of the PSR model.
CSX appears to be pretty set in its ways and is sticking to version of PSR. It admits to a need to solve the train and engine (T&E) crew shortage problem and revise its future statistical manner for keeping a suitable reserve labor pool. The CSX submission offered rationale and some statistical reasons for service disruptions and why it’s not making any different changes to the service or operational model.
So, four railroads and four different technical responses is what this strategic railway old-timer sees.
Shippers and receivers: As freight customers, what do you see as the updated service carrier reports? Are the carrier responses consistent with what your supply chain costs are recording? The core question: Are you as buyers going to stay the course with rail or shift?
UNION PACIFIC
In its STB letter, UP concluded that its submitted Revised Service Recovery Plan is designed to grow UP’s workforce, improve the customer experience, and alleviate congestion on the UP track network. UP management is confident in these proactive measures.
Here is what UP’s is targeting as its success factors: Its five key metrics as managers are: 1) Origin first-mile and destination last-mile; 2) Average Car Velocity; 3) Network Car Inventory; 4) a KPI (Key Performance Indicator) measure it defines as Cars per Carload; and 5) a Trip Plan Compliance (TPC) score card measure.
Here are UP’s year-end 2022 target KPIs:
By the end of December 2022. UP’s goal is to achieve a system target for First Mile/Last Mile freight network service at above a 91% performance. Note: this FM/LM metric measures the percent of time that the local UP pickup and deliver carload service schedule provided to the customer was achieved and provides insight into the customer experience.
UP’s Average Car Velocity target is a range of 205 to 210 miles per day per (carload) freight car in the next six months. Intermodal would likely be a higher mileage number.
Utilizing current carload forecast—while accounting for historical seasonal patterns for the month of December—UP is targeting an overall carload operating inventory volume of ~193,000 units by the end of December 2022, with a probable statistical range of between 188,000 to 198,000 carloads.
UP’s unique KPI, called Cars per Carload, is targeted to achieve a system average of cars per carload at 7.9 by the end of December within a range of 7.7 to 8.1. This Cars per Carload measure is the operating inventory required to generate one revenue carload, and is calculated by dividing the total car operating inventory (the SUPPLY SIDE) by the average daily number of revenue carloads (the DEMAND MARKET SIDE) on the UP.
UP also calculated an estimated carload TPC (trip plan compliance) estimated target. This TPC includes a day of predicted service delivery plus a 24-hour allowance under the STB requested definition. It’s broken out into several different train service types:
- TPC for Manifest trains targets are 70% by the end of December 2022, with a range of 66% to 73%.
- TPC Bulk train service December target is 81%, with a range of 77% to 85%, within the +24-hours.
- The TPC Intermodal train hub-to-hub performance target is 80% by the end of December, with a performance range of 76% to 83%
UP updated its locomotive fleet initiatives. UP has already added 150 locomotives to improve network fluidity and will prepare 300 additional locomotives for a return to service in anticipation of growth expected later this year.
UP also continues with its target TE&Y hiring plan and remains confident of its ability to hire ~1,400 people in 2022.
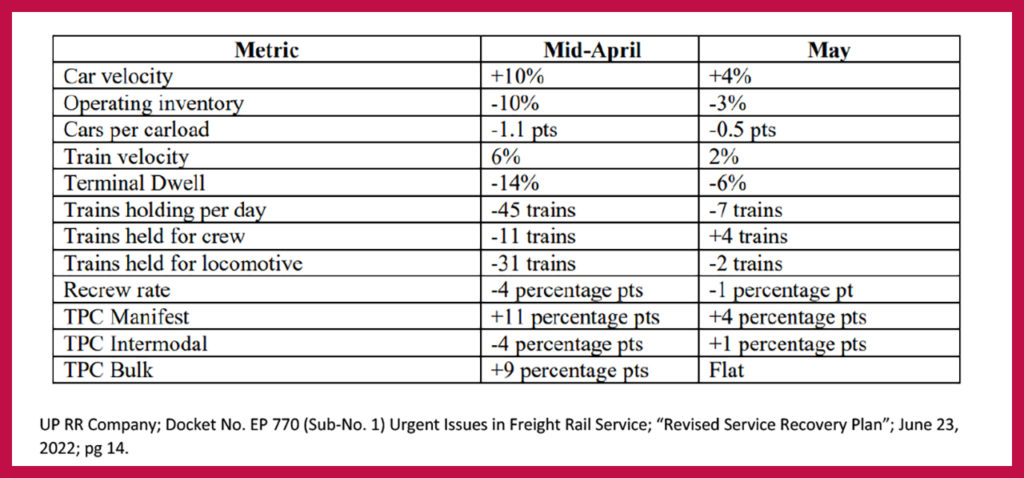
Here is UP’s table identifying recent multiple service metric changes in the months of April and May of 2022.
Blaze takeaways from this Union Pacific report card:
A summary of UP’s problems yet to be resolved
- Not much additional data revealed as to cause and solutions.
- Might be oversimplifying its labor force rehiring challenges.
- Power availability looks better—but without crews,added locomotives might only be of limited value.
- Doesn’t appear to have similar congestion problems that BNSF identified, thus creating a possible western competitive advantage for UP.
- Technically, no UP embargo. But UP is lobbying to keep some private shipper leased or owned freight cars off network (my interpretation).
BNSF
BNSF opened its delivered report by acknowledging that its service has not been meeting “our customers’ expectations for several months.” It also recognized that “while our service would steadily improve, it would be in an uneven manner across the different segments of its multiple state network of lines.”
While BNSF managers have seen signs of recovery across many parts of the network, they admit that some other parts of the network like the transcontinental line reaching into southern California from Chicago and Texas remain “challenged”—so challenged that BNSF on June 27 initiated a partial embargo on some traffic into the month of July.
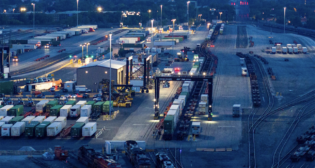
BNSF’s westbound and eastbound volume levels have resulted in significantly imbalanced crew and locomotive asset geography across the BNSF Southern Transcon corridor. This includes trains that traverse the tracks between Barstow and Needles, Calif. The California congestion reflects in part impacts from track and yard congestion as far east as the Chicago intermodal terminals, and the main line passing sidings on the approach into Joliet Illinois and Chicago intermodal facilities.
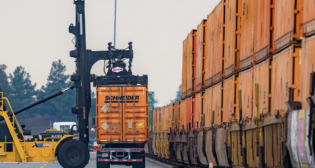
At key inland markets like Chicago, sustained strong volumes, longer dwell times and intermodal chassis constraints resulted from high volumes of eastbound intermodal loads waiting to be removed by customers from BNSF-served Chicagoland terminals, especially at its largest such facility, the Logistics Park Chicago (LPC) intermodal yard.
Result: a significant number of eastbound trains heading for LPC were “staged” in sidings across the Southern Transcon waiting to arrive at and be unloaded at LPC. This phenomenon has, in turn, reduced the velocity of intermodal flatcars due to their inability to be unloaded and the subsequent slowing of their return to the West Coast to handle the continued strong demand for imported cargo.
On a positive note, BNSF reports that its Northern region between Chicago and the Pacific Northwest has witnessed increased velocity and decreased yard dwell times. Velocity on the Northern region increased 5.9% in May vs. April; there has been an improved 7.4% reduction in dwell in that region since January 2022.
However, system-wide crew availability remains a challenge as BNSF employees exercise their collectively bargained vacation time rights. BNSF estimates that crew unavailability due to vacation time should peak in the week of the July 4th holiday and then decrease over the remaining summer months.
In the labor area, BNSF has extended financial offers around the network for voluntary vacation buybacks with a focus on employees at the terminals and across BNSF facilities on the Southern Transcon. BNSF reports hiring approximately 1,420 new employees thus far in 2022, with 805 of them being hired just since the beginning of April. More than 1,700 of the 3,000 total new employees will be additional TY&E employees. Thus far in 2022, more than 659 new TY&E employees have either been hired or completed training. BNSF expects approximately 300 to complete training in the next 90 days.
That’s a small net gain. However, the BNSF attrition rate suggests that “these 3,000 new hires will keep the overall employee count generally flat throughout 2022”—and perhaps only up by about 200 total by March of 2023?
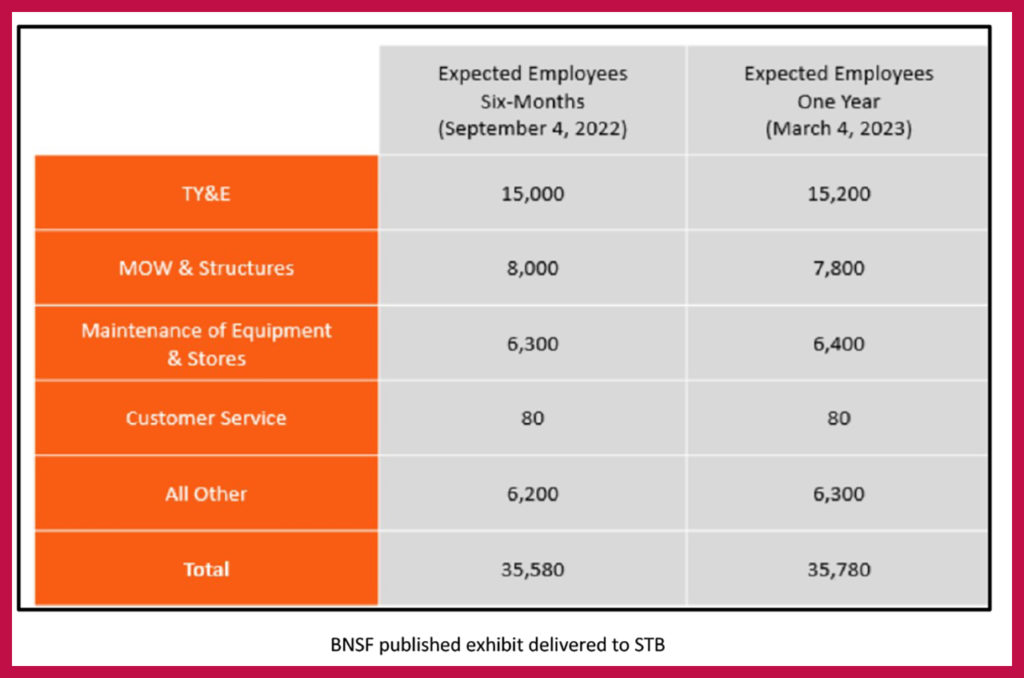
The chart below identifies the number of employees BNSF anticipates it will need and expects to have employed at the six-month and one-year marks. Notably, when compared to BNSF employee counts as of January 2022, the anticipated employee figures in the chart represent an approximately 5%-6% increase in BNSF’s overall employee count and a 7%-8% increase to its collective TY&E, M/W & Structures and Maintenance of Equipment & Stores employee count.
BNSF has increased the size of its locomotive fleet by 350 units since the start of the winter of 2021-22. To lessen the impacts of service interruptions due to mechanical problems, BNSF has added mechanical skilled responders to assist in expediting service restoration by doing more repairs on-site in field locations and increasing the opportunity to avoid having to move the equipment to repair shops. It has arrangements to lease an additional 75 locomotives.
Chicago waiting train delays: In part, this kind of problem has resulted in BNSF’s past weekend embargo, a measure none of the other three railroads has taken.
BNSF described its main line blockage problems in this way:
“We are forced to stage trains at various places across our network as they wait for landing capacity to become available at LPC, including in areas that are jointly used in Southern California to support business utilizing our Southern Transcon lines. For example, at the start of this week, there were 28 trains waiting across the Southern Transcon for arrival slots at our Chicago intermodal facilities.”
To address these issues and ensure productive work at the LPC terminal, BNSF was working with San Pedro Bay port terminals on slot allocations to better ensure volume is loaded to LPC to match the truck/chassis capacity to outgate units.
Then BNSF wrote: “Over the next two weeks we will begin limiting the total number of intermodal trains originating from California facilities and destined to LPC.”
Embargo exceptions could occur. BNSF reported that after the first week of the embargo it was announcing—which will include the July 4th holiday period—that BNSF managers anticipate implementing exemptions to the embargo for certain “public welfare” commodities. The embargo might not necessarily extend out for the entire month of July.
BNSF at the time of its 23 June filing was already reaching out to customers individually in advance of the embargo taking effect. This meant that rumors of a possible embargo were circulating among some BNSF customers about two days before the official announcement.
Near-real-time customer tracking: BNSF tells its customers that they can use a variety of BNSF tools to compute or otherwise follow the direct impacts on their cargo out of the embargo. Those tools include:
- Track my Train, “which allows customers to track the trains on which their shipments are moving across our network.”
- Geofence Notifications “that inform BNSF customers on a car-specific basis when their shipments pass into geographic boundaries that have been set by the customer.”
- A Railcar Management Tool allows BNSF customers to view and manage all cars that are either at or inbound to that customer’s facility, with real time status updates as cars are released.
- Message Us, “a tool that gives our carload customers a real time interface to escalate issues within BNSF and see a record of any requests they have previously made.”
Arguably, some of these tools are not actually “real time” event recording, but more so a likely near-real-time accessible record.
This kind of extraordinary event following is where and how independent emerging telematic companies like TrinityRail/Quasar, Amsted Digital Solutions, RailState and others might play a more important role in helping rail freight customers correct their impacted supply chain TMS inventory data feeds.
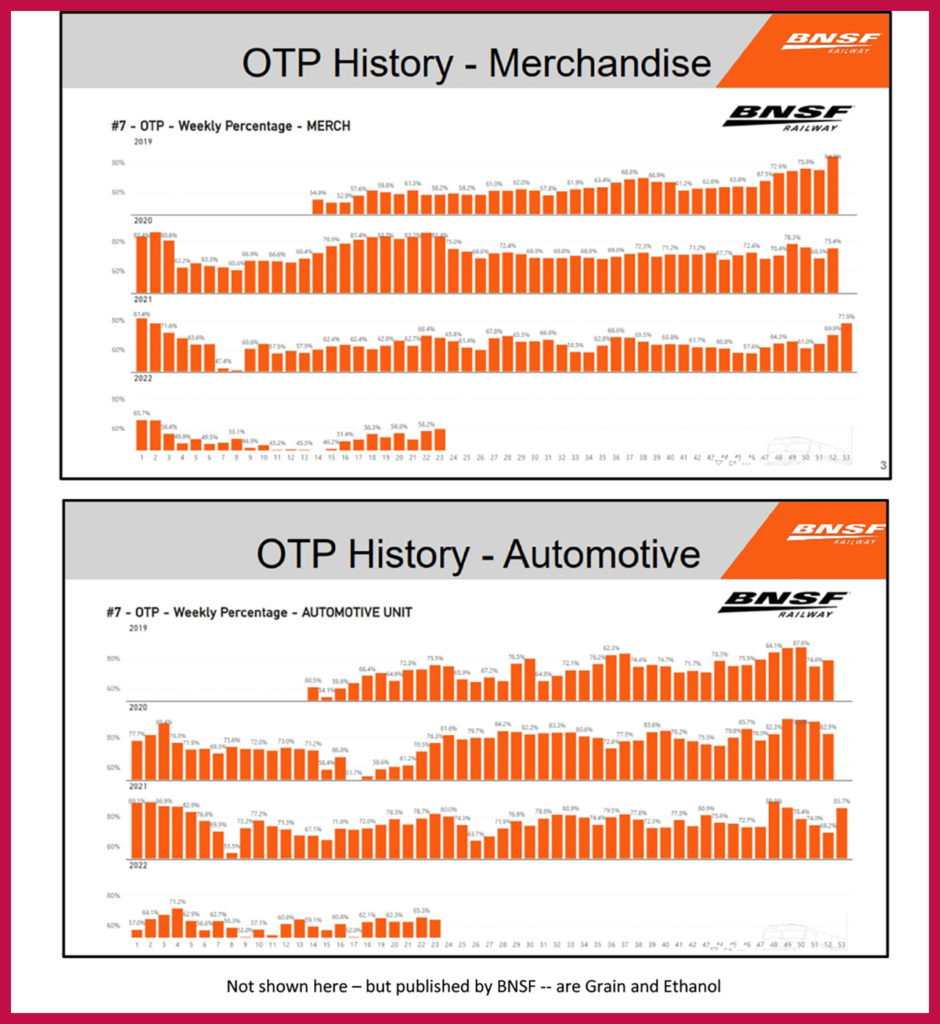
Target-rich KPIs projected: BNSF appears “loaded for bear” when it came time to summarize improvement goals. It set the stage by looking forward and honestly revealing how relatively poor its performance appears to have been looking back some 36 months. BNS is not hiding. This looks like old-school management techniques of “you can manage what you have measured.”
The STB’s June 13 decision directed BNSF to also identify six-month OTP (on-time-performance) targets broken down between specific categories from the Board’s May 5 decision. BNSF responded openly with easy-to-read graphics, breaking the past and projected future down into manifest, intermodal and unit train types. It even broke unit trains down further by grain, coal, auto, crude and ethanol commodities.
Here are BNSF’s six-months targets for each of those categories.
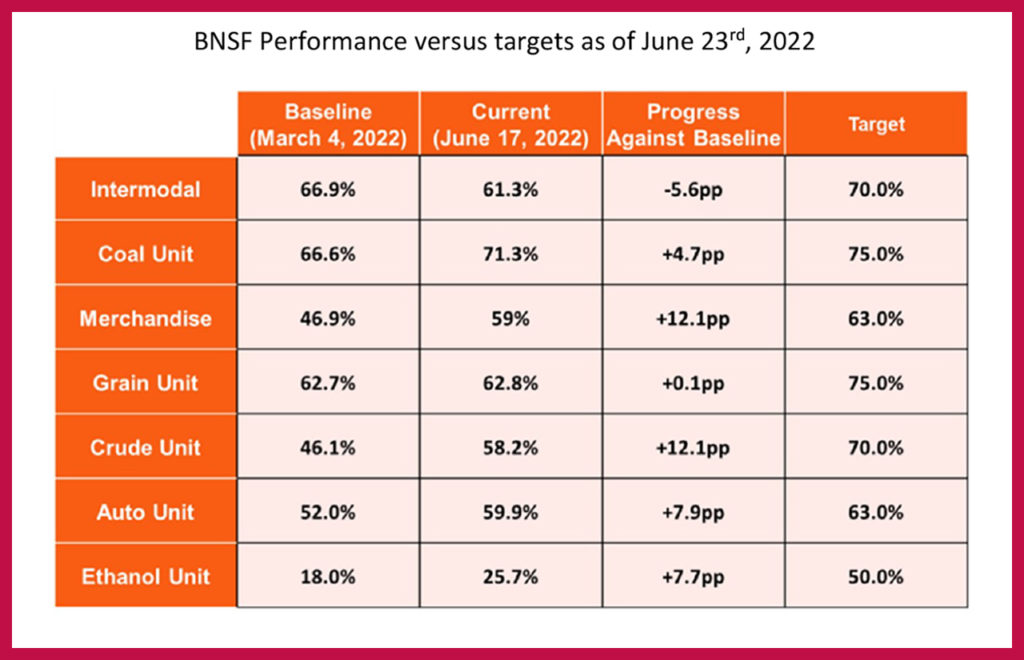
And here are the exhibit charts reflecting 36 months of historical BNSF data for those same categories. This is a very bold open communication about the basis for BNSF’s Supplemental Service Recovery Plan—a data rich environment open for customer and regulatory review.
Blaze takeaways from this BNSF report card:
- It is a tough look but a candid report by BNSF’s team.
- Little evidence of a continuous service improvement back to 2019.
- Identifies and admits to random service failure patterns.
- Labor force T&E outlook looks to be a continuing problem over the next year—reflecting the independent outlook offered by Loop Capital Markets during Rick Peterson’s April 26 testimony and calculations.
- Power availability looks better, but without crews might only be of limited performance increase value.
Norfolk Southern
Norfolk Southern’s response to the STB regarding supplemental intel to the “Urgent Issues in Freight Rail Service – Railroad Reporting Docket No. EP 770 (Sub-No. 1) was to acknowledge in its transmission letter “that our service product is not performing at the level that we expect of ourselves and, more important, that our customers deserve and expect.”
“On behalf of our entire organization, I can assure you that every Norfolk Southern employee, from our crews to our senior leadership team, is focused on the restoration of our service” said the transmittal letter signed by President and CEO Alan Shaw.
The message seems to conclude that NS would strive to overcome crew shortages by in large part introducing its new “operating system,” (TOP | SPG) that will make the railroad’s everyday operation simpler and more consistent. At the same time, Shaw said the foundation to restoring NS’s network fluidity is to address crew shortages “even while we face an historically tight labor market by focusing on recruiting, training and retaining our transportation crews.”
The responsive material begins by citing that NS has created an internal econometric analysis from its internal historical data to attempt to empirically tie its targeted employment levels to improvements in network service metrics.
After a brief discussion of what it sees as the root causes of the current service issues, NS then provides more details about current hiring efforts, the refinements to the new operating plan, and current ongoing customer service activities. NS also discusses energy management and locomotive power as to the impacts of those features upon service. NS concludes with a forward-looking description of employment targets and their service metrics.
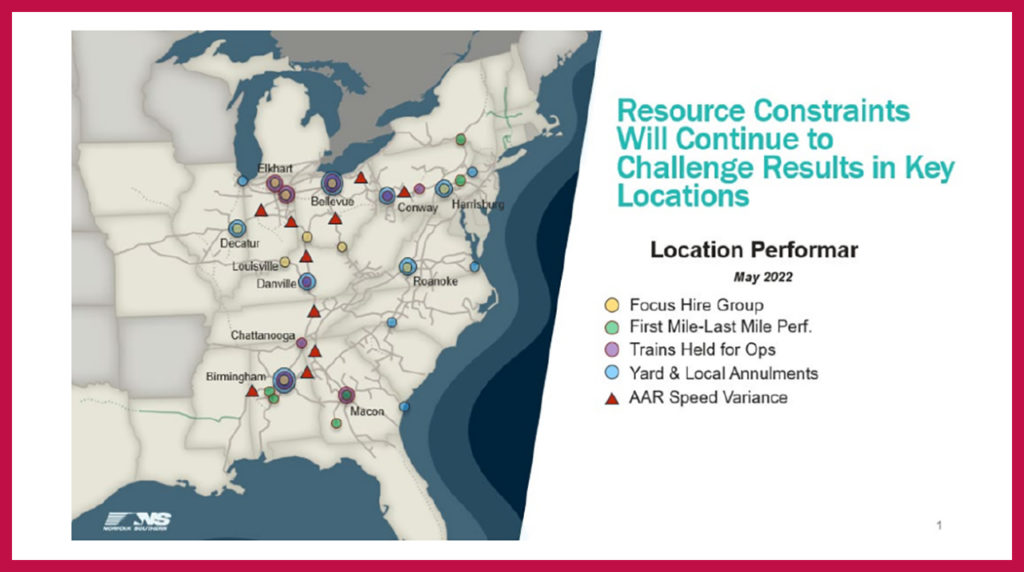
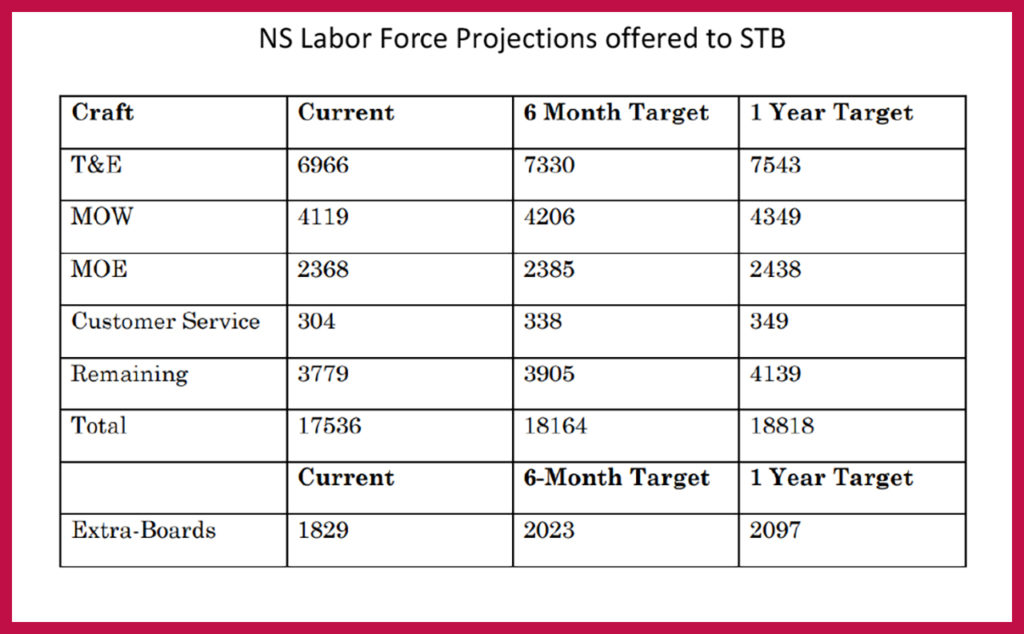
NS describes critical places where trains are being held awaiting crews, resulting in local train annulments. The cited locations include Birmingham, Bellevue, Decatur, Harrisburg, and Macon. NS’s aggressive hiring practices are, it says, the “specific actions” it is taking to improve service.
Having explained that its service problems are resulting from T&E needs, NS’s plan to recover specifically addresses actions to increase its T&E headcount. It points out that it has voluntarily provided the STB with confidential monthly reports to provide additional insight into its progress toward qualifying additional T&E employees. As of mid-June, the NS current system-wide goal for qualified T&E employees is 7,543. After accounting for employment attrition, NS calculates that there were 7,052 qualified T&E employees as of June 20, 2022.
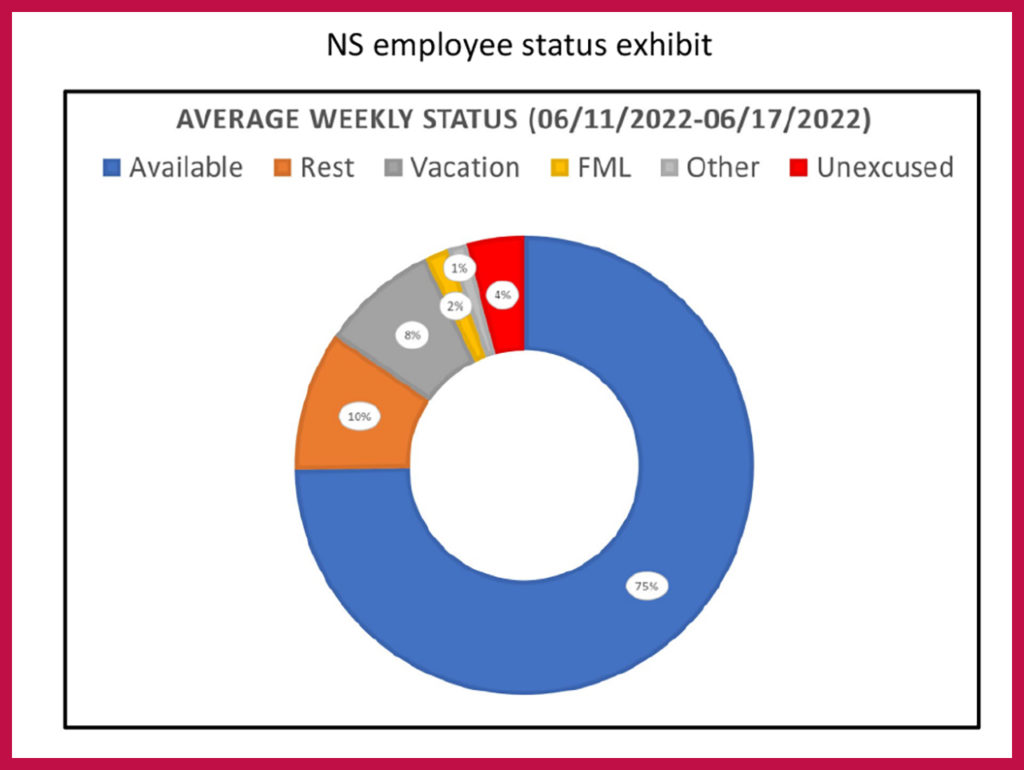
NS then identified certain employee available business conditions. For example, during the week ending June 17, 2022, data shows that on average, 75% of total qualified T&E employees were available to work on a given day. However, there are certain exceptions. Adjusting for such exceptions, NS reports that, on average for the week ending June 17, 2022, 6% of those employees showing as “available” were in fact not subject to call.
Translation? This means that that the average of qualified T&E available for work was in fact just 69% of total qualified T&E employees. That number fluctuates depending on day of week. As a benchmark, NS reports that on average, a qualified T&E employee will complete between 3.5 and 3.8 train starts per week.
Deployment of forces: NS explained in its confidential reports that certain locations are receiving the greatest focus when it comes to deploying new hires. Separately, NS is submitting to the STB monthly a list of ten of its critical hiring locations.
As was reported by several of the other responding railroads, NS is using bonus pay to attract new-hire candidates. It says that it has increased conductor trainee pay to $185 per day with additional bonuses up to $5,000 paid at key milestones early in their tenure once they have completed training and have worked in the field for nine months. For the record, on some railroads, bonus payments could be as high as $10,000 to $15,000.
NS is also employing the use of selective transfers. It is taking existing crews in surplus areas and negotiating to transfer some to help relieve staffing deficiencies in other critical NS network locations. NS also has a vacation buyback program with an incentive payment to employees in particular locations that are willing to work through an approved week of vacation.
Labor pool lessons learned: NS admits that there has been a fundamental change in the U.S. labor market. And like all industries in America, NS will need to adjust its employment practices to ensure that it has a robust labor force sufficient to meet current and future rail transportation demand.
What does this mean more specifically? First, according to its report, it means that NS is looking for ways to add resiliency to its network. Furthermore, if NS witnesses another sharp drop in demand for service, it says that it will need to factor the current labor conditions into its decision on how many employees to furlough, as the company must expect fewer of those employees to return to work when called in the current (future) labor market.
NS concludes that “the hard lessons of the past two years will guide Norfolk Southern’s future employment decisions for years to come, until the tight labor markets return to historic norms.”
Operating plan changes: NS responded to the STB’s inquiry about why the new operating plan, TOP | SPG, is different. NS first replied as to its leadership team now being focused on a data-driven approach. Now the goal is to use data to put together a daily operation plan that can be successfully executed for that day, accounting for the internal and external variables that will affect rail operations.
NS also told the Board that it believes that it has the right amount of (management?) people and other critical resources (such as locomotives) available to operate to the data-driven plan. In its statement, NS describe the TOP | SPG as “an evolution of our previous operating plan, TOP21, to better serve the changing needs of our customers.” The new TOP | SPG plan launched June 27, 2022. It’s define as being centered around Service, Productivity and Growth.
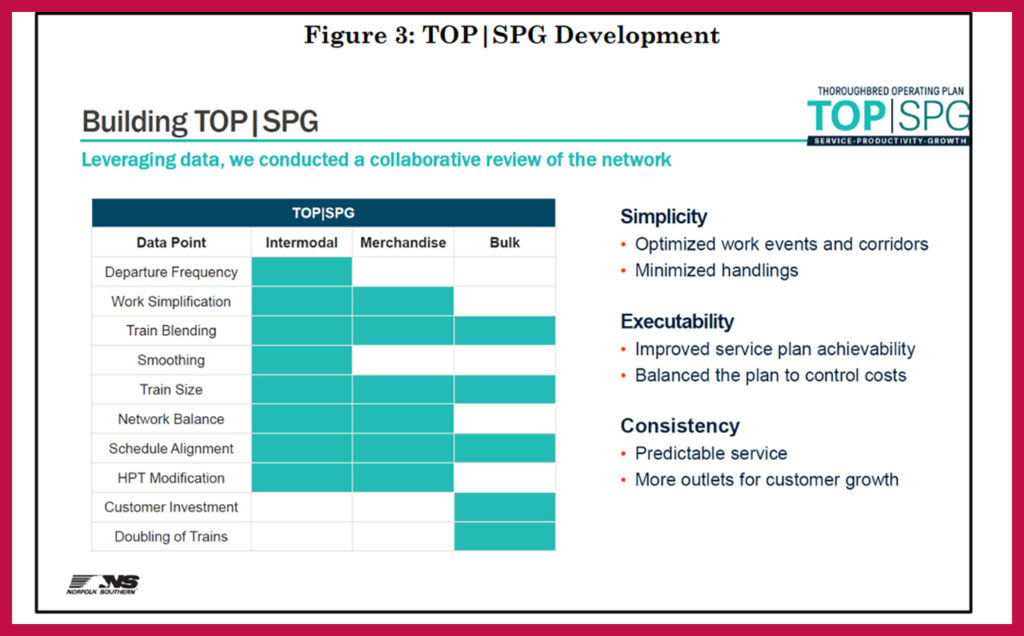
Alert: There is not a lot of technical detail here, but NS does provide a Figure 3 from the document that purports to explain why this model transition is better than the prior one. TOP | SPG was developed by leveraging data to conduct a review of Norfolk Southern’s entire network. The TOP | SPG team evaluated numerous datapoints across the various commodity groups to ensure that all aspects of the network were taken into account, as illustrated in Figure 3 from the June 23 document:
Target improvements: If the model works as intended, NS expects to see the following improvements in network productivity:
- This operating plan will adjusts run time for 56% of the NS train symbols.
- This model should adjust 39% of its yard blocks.
- And it should modify 90% of its scheduled trains.
If it works as designed, here are the predicted results to look for:
- TOP | SPG will reduce imbalance in the network.
- Will simplify routes, terminals and traffic lanes.
- Will increase direct shipments, from one terminal origin to one market destination for the NS intermodal customers.
NS explains this with this simple diagram labeled as Figure 4 in their filing at the STB:
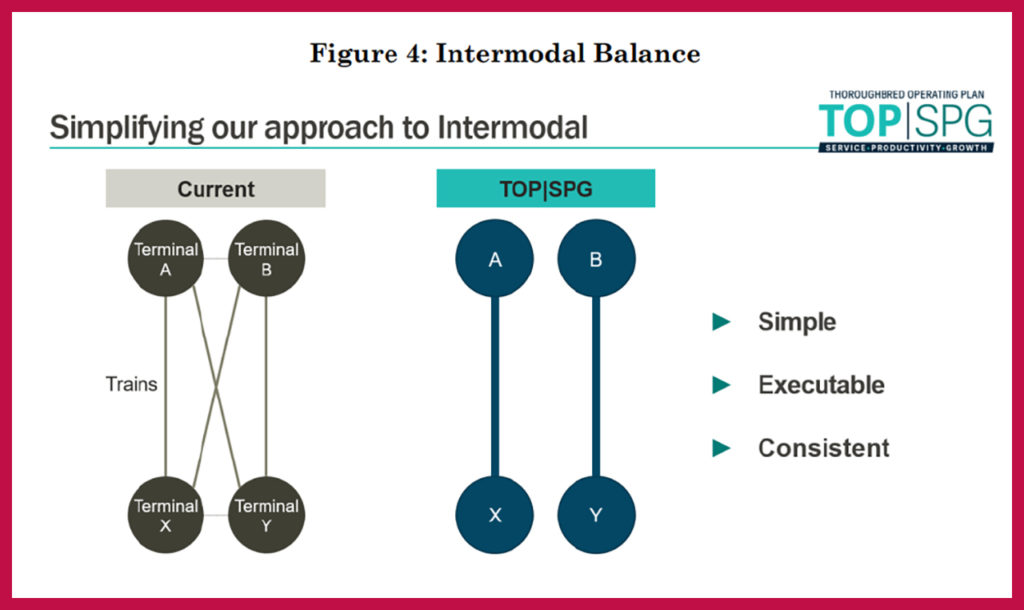
Here is the intermodal explanation: As part of new TOP | SPG operating plan, NS will re-work its intermodal service to enhance its service and improve network fluidity, as illustrated graphically in the STB document Figure 4. For example, let’s looks at the NS local intermodal service between Chicago and Harrisburg, Pa. Currently, NS has one scheduled intermodal train operating between 47th Street Yard in Chicago and Harrisburg Yard. There are two scheduled trains between 63rd Street Yard (also in Chicago) and Rutherford Yard (also in Harrisburg). Because there is only one train per day operating between 47th Street and Harrisburg, a customer whose container misses the launching of a train at 47th Street needs to wait 24 hours before the next train from that terminal to Harrisburg. This also means that containers at 47th Street will tend to dwell for up to 24 hours between trains.
However, once the new TOP | SPG system is launched, local intermodal service between Chicago and Harrisburg will be consolidated. NS will have four scheduled trains operating between 47th Street and Harrisburg. No local trains will operate between 63rd Street and Rutherford. This means that a customer whose container misses the launching of a train from 47th Street will only need to wait about 6 hours on average before that container will leave on the next train.
NS argues that this new operating plan has two primary benefits over the current operation. First, because there would be four trains from the Chicago market instead of three, and because traffic will be consolidated at a single origin terminal with more-frequent train launches, containers will dwell less often at origin, and customers will benefit from faster service. Second, the network will benefit from greater fluidity because the reduced container dwell at origin will mean less terminal congestion, improving traffic flows in and out of terminals.
The critical plan assumption is that this new system balances the flow of shipments through terminals, intermediate yards and the overall network.
NS also says that the new plan will enhance the capacity of its network by enhancing train size. Enhancement means what? This enhancement focuses on increasing the length of NS’s existing smaller trains to absorb capacity, rather than making its existing already very long trains longer. Enhancing train size increases capacity without requiring additional crews. It can enable Norfolk Southern to transport more product for customers is the follow-on claim.
NS continues to reorganize its customer service structure and workforce. It asserts that this is all part of its commitment to providing best-in-class customer support. Readers should investigate these claims further in the public STB filing available on-line.
NS made its Predictions of Service Recovery and Employment Levels. But it defined them with the remark that they are “Uncommonly Speculative in This Environment.”
Here are NS’s suggested service metrics changes out toward year-end 2022. As a note, NS does not normally use its ETA precision-scheduled metrics to track train performance like some of its competitors do. For example, NS reports that it evaluates its unit train service in terms of cycle time and order fulfillment. For example, a unit train customer may order 7 trains in a month. If NS delivers those 7 trains, then order fulfillment is considered successful.
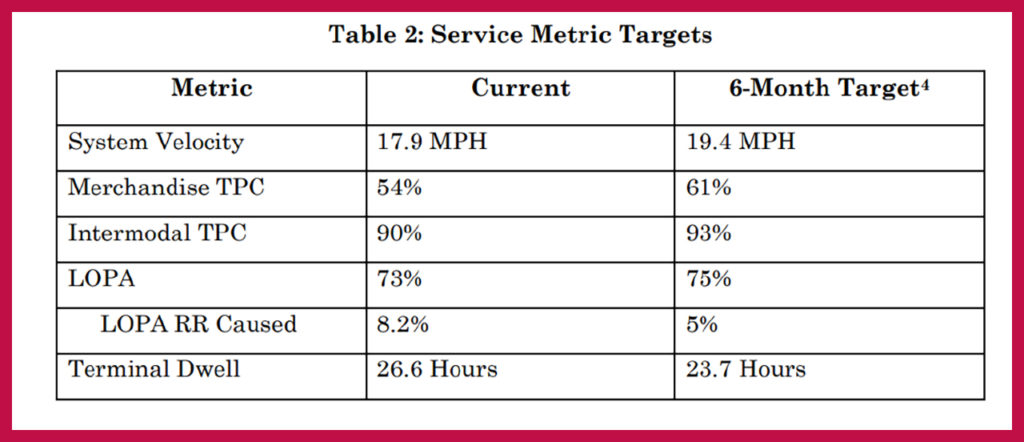
NS also looks at cycle time; e.g., how long does it take the unit train to run from origin to destination and return? Readers should be aware of this difference in the NS service performance monitoring.
Blaze takeaways:
- None of the six months NS service metric changes appears to be either breakthrough or world-class performance results.
- The technical workings of the NS new operating plan are now well defined as to the process. There are no R&D test results upon which to make an outsider’s judgment about the effectiveness of the changes.
- NS appears to state that it does not use trip compliance analysis to measure the quality of its growth product “intermodal sector.” That seems out of touch with what truckers and other railroads do. To comply with the STB request, it calculates a 24-hour leeway window and then asserts that its new operating plan model will achieve at best perhaps a projected target of 93% of intermodal trains arriving at the NS local system intermodal destination within 24 hours of the Original ETA—which NS says is a reasonable goal in the current service pandemic era environment. However, in premium intermodal business, given the relatively short NS local network intermodal movement distances, that schedule time plus 24 hours seems like a poor expected result. In addition, that is a hard market selling message (sales line) to offer customers in this regulatory proceeding. Why? Because customers are following this proceeding closely. They know what premium intermodal service should perform like.
I expect that NS may very well reconsider that intermodal assessment. It should be targeting the previous leader in the intermodal field, Conrail, as to performance—and striving to at least match the performance of the current CSX intermodal compliance.
Final observation: NS appears to significantly discount the value of first-mile/last-mile railroad performance. That is at odds with a number of its railroad competitors, and certainly with truckers. NS uses the term Local Operating Plan Adherence (LOPA). The reason for ignoring its planning value appears to be that NS’s first-mile/last-mile metric regression analysis did not show a similar relationship to employment levels as did system velocity and Merchandise TPC. Thus, the same regression analysis was not possible to project a target for this metric.
While that might be true as a predictor of labor pools, it seems inconsistent with service requirement signals from the marketplace as to what customers and NS’s competitors are thinking. Further, a number of us retired older-generation folks think that when you are short of crews, the main line trains will always run because that’s where the high margins are earned—which often can result in local pickups and drop-offs not getting the priority.
CSX
CSX offered one of the shortest responses. It directly stated in its summary that it is “committed to providing safe and reliable transportation” for its customers. A major priority for CSX appear to be increasing its T&E employee hiring and retention rate. CSX expects its initiatives on these fronts to continue to be successful during the six-month reporting period. Further, as the crew situation normalizes, CSX expects that its service will be restored to pre-pandemic levels and continue to show progress thereafter.
CSX provided a year-end target of 7,000-7,100 active T&E employees. CSX views this workforce level as “a baseline to provide a strong service product and meet current customer demand.” Extending over the next one to two years, CSX “will continue to hire to support continued business growth and expects an active T&E count in the range of 7,000-7,500 employees.”
CSX says that its Customer Solutions team is “appropriately staffed, and is familiar with shipper needs, and communicates frequent updates to the shipper up to and including confirmation that the [problem has been resolved.”
CSX is in year 4 of a planned 5-year modernization of its IT product called ShipCSX. CSX recently updated its Shipment Problem Resolution tool, which “provides a user-friendly interface for customers to view shipments and advise the Customer Solutions team.”
CSX argues that it has sufficient locomotives on hand and sufficient quality locomotives in its train consists. With respect to having sufficient power on the network, CSX “has already placed more assets, including locomotives, on the network in order to handle current traffic levels.” CSX noted at the April STB hearing that it had more locomotives on the network than needed.
CSX’s reduction in velocity between December 2019 and May 2022, as cited by the Board, is directly related to crew availability and its impact on network efficiency. With respect to whether utilizing additional power on through trains would allow them to maintain velocity when power at existing levels breaks down, CSX currently has a historically low rate of road locomotive failures. Year-to-date 2022, locomotive failures account for only 1.25% of CSX’s total train delays. In addition, CSX says that it “proactively uses real time locomotive data and diagnostics to perform more effective maintenance and identify [problems] before they cause a locomotive failure.” It concludes that, in a low failure rate environment, the use of extra power when the horsepower is unnecessary to pull the freight would be an inefficient use of assets, would add to the train length and would require additional resources to position and maintain the additional power.
With respect to network velocity, CSX previously explained that it has no system-wide velocity restrictions in place, and that localized velocity restrictions (slow orders) may be used where necessary for operational or safety reasons, and that its intention is “to move at track speed whenever appropriate.” CSX instead runs its trains and positions its resources “in accordance with an operating plan that seeks to optimize overall network fluidity.” CSX argues that operating at the fastest possible speed between two points (as some would urge) does not necessarily further this goal.
As for overall system performance, CSX asserts directly that its managers “adjust its blocking plans to optimize car flows in line with traffic patterns.” CSX has also “consolidated train starts, eliminated unnecessary stops, extended sidings to add capacity, upgraded locomotives with Distributed Power capability, and strategically positioned locomotives throughout the network to respond to demand.”
CSX says that it will “continue to reevaluate its service design on a daily basis and implement changes where circumstances warrant,and opportunities exist.”
In order to determine targets for each of its key service indicators, CSX reviewed historical data for each metric 2019. Why 2019? That was the most recent year when CSX was last providing service at a high level. This period was chosen because CSX is focused on returning to 2019 levels, and then improving even further from that baseline. The 2019 service data was then cross-referenced against staffing levels for the same period, taking volume into account. CSX used that to then determine an appropriate six-month 2022 target for purposes of this probe by the STB about service recovery.
CSX compared the 2019 crew/service baseline to its expected crew levels over the reporting period, and projected an expected improvement in the various metrics given the expected improvement in crew availability (i.e., crew markups) over time.
CSX Year-End 2022 Targets
Velocity: CSX velocity metric as a performance indicator was reported as 20.6 miles per hour for week 24 (the week ending June 17). CSX expects that, at the end of the six-month reporting period, velocity will be at or above 23.5 miles per hour.
Terminal Dwell: System-wide dwell was 25.8 hours for week 24. At the end of the six-month reporting period, CSX expects terminal dwell to be at or below 22 hours.
System-wide Train Performance Compliance outlook: Manifest carload type TPC for CSX is 70% for week 24 and the CSX initial service recovery plan at the end of the six-month reporting period will be at or above 80%. TPC unit train metric was 90.8% in the aggregate for week 24, and the six-month CSX target will remain at or above 90%. TPC Intermodal metric for CSX was 97% for week 24 and will remain above 95%.
First-Mile/Last-Mile: CSX’s methodology derives data for FMLM metrics by examining the percentage of scheduled spots and pulls that were fulfilled within the planned initial work window. Because the Board’s metric only requested information for spots and pulls, CSX excluded intra-plant switches and cars planned to an interchange junction. System-wide FMLM was 81% for week 24. At the end of the six-month reporting period, CSX expects that this figure will be at or above 85%.
Blaze takeaways: CSX remains very aggressive as to its train service performance targets. Overall, CSX is a top performer among the Big 4 as to the service delivered. CSX did not waste a lot of paper or space in providing responses to the STB. Its assumed number one priority for better service is to normalize crew availability. It’s sticking to its April testimony whereby “[a]s the crew situation normalizes, CSX expects that its service will be restored.”
CSX did not provide any tables or graphs to cement their assertion. It doesn’t look like CSX is changing its operational model. That makes its stand out from the other three Class I’s under STB review.

Independent railway economist and Railway Age Contributing Editor Jim Blaze has been in the railroad industry for more than 40 years. Trained in logistics, he served seven years with the Illinois DOT as a Chicago long-range freight planner and almost two years with the USRA technical staff in Washington, D.C. Jim then spent 21 years with Conrail in cross-functional strategic roles from branch line economics to mergers, IT, logistics, and corporate change. He followed this with 20 years of international consulting at rail engineering firm Zeta-Tech Associated. Jim is a Magna Cum Laude Graduate of St Anselm’s College with a master’s degree from the University of Chicago. Married with six children, he lives outside of Philadelphia. “This column reflects my continued passion for the future of railroading as a competitive industry,” says Jim. “Only by occasionally challenging our institutions can we probe for better quality and performance. My opinions are my own, independent of Railway Age. As always, contrary business opinions are welcome.”