Commentary
BNSF Desperate for an Inflection
Written by Rick Paterson, Managing Director, Loop Capital MarketsThe Smokehouse Creek wildfire in Texas, which severed BNSF’s Transcon route on February 27, was the latest in a series of problems that have significantly slowed BNSF’s network and impacted service. After running well as recently as December, BNSF now finds itself in a hole.
We were hoping for an inflection in network velocity in the week following the wildfire effect, ending March 8, but instead we saw another sequential deterioration, from 25.1 to 24.8 mph. Within this number, Manifest service average speed fell from 22.3 to 21.7 mph, and Intermodal from 30.1 to 29.5 mph. All these speeds are materially lower than where they bottomed during the Arctic Blast in the third week of January, and except for Manifest you need to go back to June 2022—in the depths of the service crisis—to find comparable numbers.
Just as worrisome is the recent increase in cars on line. From a weekly average of 248,000 in 2023, it rose to 256,000 in January, 261,000 in February, and hit 263,326 the week of March 4, which is a high we haven’t seen since November 2019. Part of this is simply due to higher volumes as BNSF handily leads the industry in terms of YTD volume growth (+5.5%), but there’s also no doubt a worrying congestion element that threatens the speed at which the network can get back in sync.
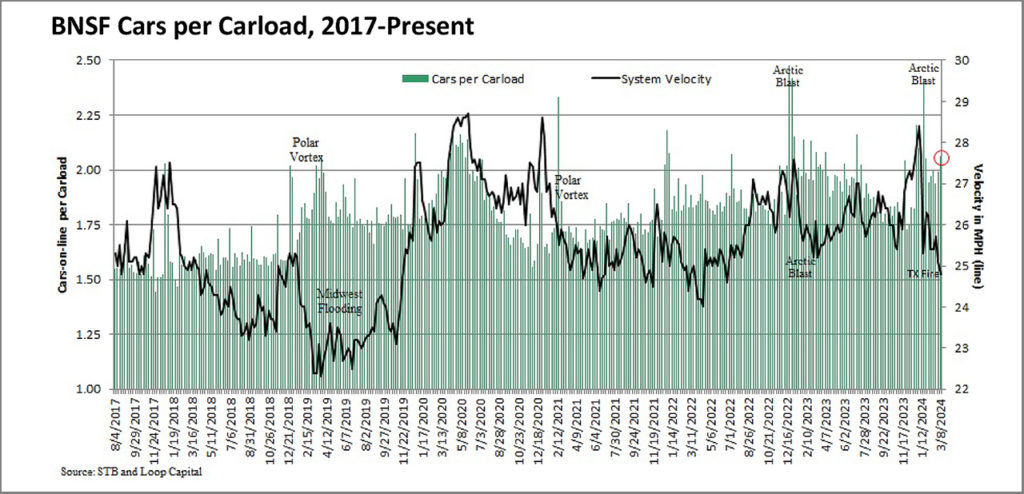
A good way to adjust for volumes and sanity check car congestion is to look at “cars per carload,” which is basically a ratio of rolling stock relative to the loads they’re transporting. In the chart below, we’ve divided weekly intermodal units by two to account for double-stacking, and added that count to non-intermodal loads to get total “carloads.” We then divide cars on line by this number to generate cars per carload, with the lower the ratio the better. If we look at BNSF’s recent history, this averaged 1.6 in 2017 and 2018, then between 1.8-1.9 in each year between 2019 through 2023. You can see by the green columns that it sometimes spikes above two times, and it was 2.1 the week of March 4 (red circle). So even after adjusting for the current strength in intermodal volumes, there’s still some evidence of car congestion. Our assumption of a two-week bounce back from the wildfire effect now looks too optimistic, and it may be more of a slower grind higher.
In terms of critical resources, trains holding for crews and power also both deteriorated sequentially the week of March 4: crews from 31 to 39 per day, and power from 13 to 17 per day. To put this in perspective, these topped out at 167 (crews) and 38 (power) during the service crisis, so thankfully we’re nowhere near those levels. Also notice we haven’t yet used the “M word” (meltdown) because BNSF has ample crews; albeit there are some crew districts with too few and others with too many, so there are imbalances to iron out. This, of course, isn’t unique to BNSF.
The bottom line is that BNSF needs to be careful here, because after what we all went through in 2022 there will be no tolerance from its stakeholders and Washington D.C. for another bout of extended service failures from a major railroad. We’re at least assured that BNSF is a quality organization that fully understands the urgency of the situation.