STB Crunches Three-Benchmark Rate Case Numbers
Written by William C. Vantuono, Editor-in-ChiefThe Surface Transportation Board in Docket No. EP 689 (Sub No. 15) (download below) has published the 2019-2022 RSAM (Revenue Shortfall Allocation Methodology and R/VC>180 (Revenue-to-Variable Cost Greater than 180%) ratios for Class I’s, as well as their four-year averages, for use in Three-Benchmark rate cases. These calculations, STB noted, are the most recent.
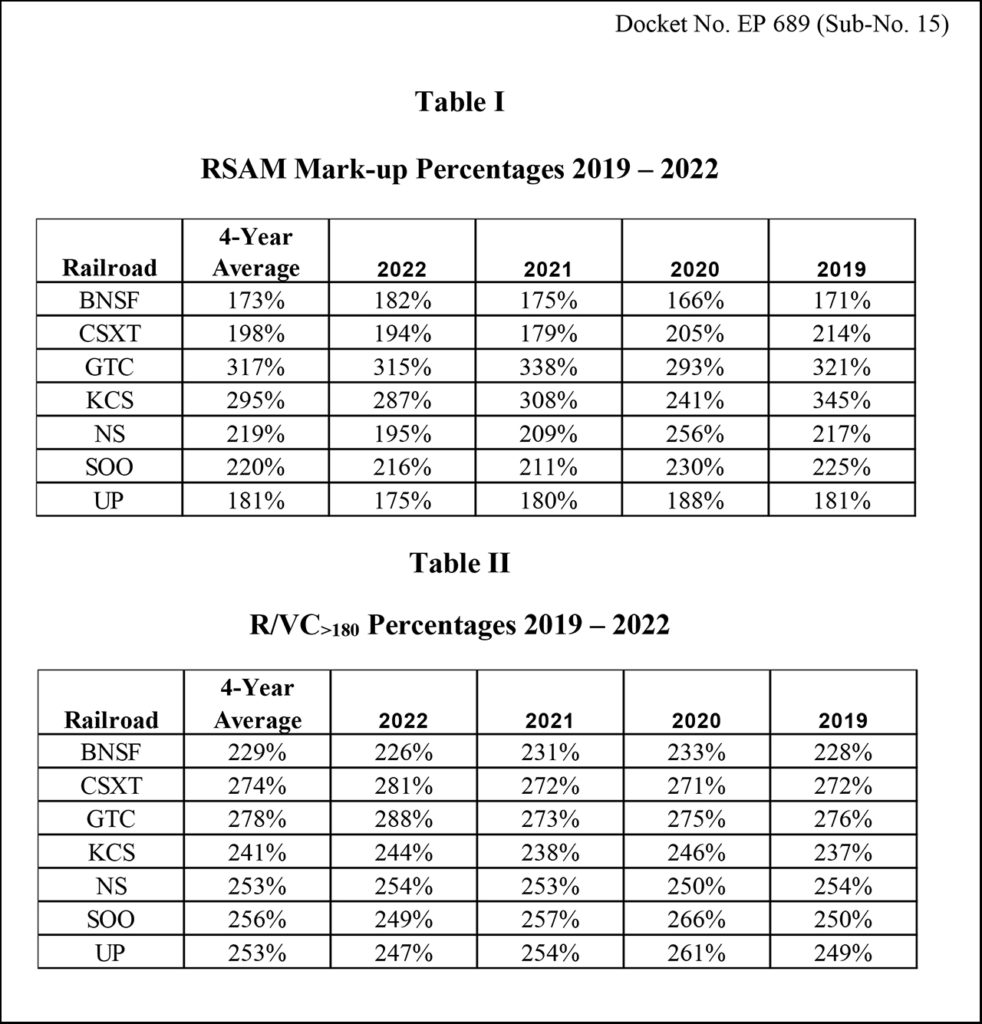
“The first benchmark, RSAM, measures the average markup that the railroad would need to charge all its ‘potentially captive’ traffic for the railroad to earn adequate revenues as measured by the Board under 49 U.S.C. § 10704(a)(2),” STB said. “Potentially captive traffic is defined as all traffic priced at or above the 180% R/VC level, which is the statutory floor for regulatory rail rate intervention. … The RSAM benchmark is calculated by adding the carrier’s revenue shortfall (or subtracting the overage) shown in the Board’s annual revenue adequacy determination, adjusted for taxes, to the numerator of the R/VC>180 benchmark.
“The second benchmark, R/VC>180, measures the average markup over variable cost earned by the defendant railroad on its potentially captive traffic … [It] is calculated using the Board’s confidential Waybill Sample data by dividing the total revenues earned by the carrier on potentially captive traffic by the carrier’s total variable costs for that traffic. The ratio of RSAM to R/VC>180 provides an estimate of how much more or less the railroad would need to charge its potentially captive traffic to be revenue adequate.
“The third benchmark is revenue-to-variable cost comparison (R/VCCOMP), used to compare the markup on the challenged traffic to the average markup assessed on other potentially captive traffic involving the same or a similar commodity with similar transportation characteristics. The R/VCCOMP ratio for appropriate comparison traffic is computed using traffic data from the Waybill Sample and applying the Board’s Uniform Rail Costing System (URCS).”