APTA Releases 1Q23 Public Transportation Ridership Report
Written by Marybeth Luczak, Executive Editor
For first-quarter 2023, Virginia Railway Express commuter rail ridership rose 113.90% from first-quarter 2022. (VRE Photograph via Twitter)
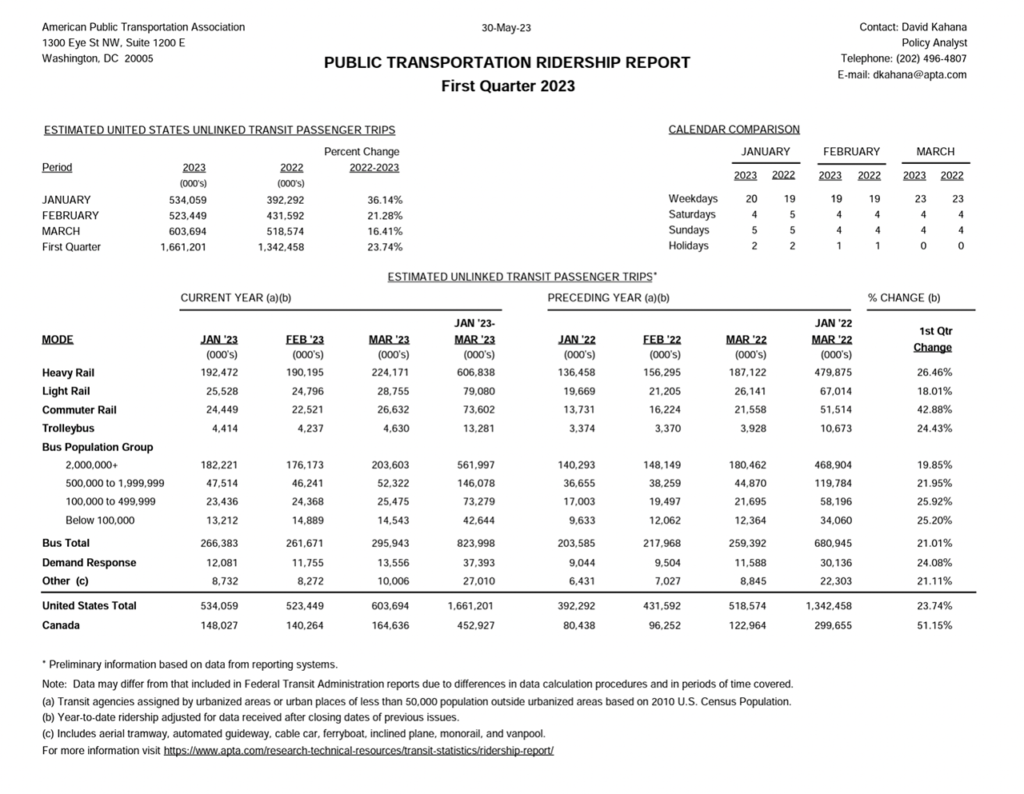
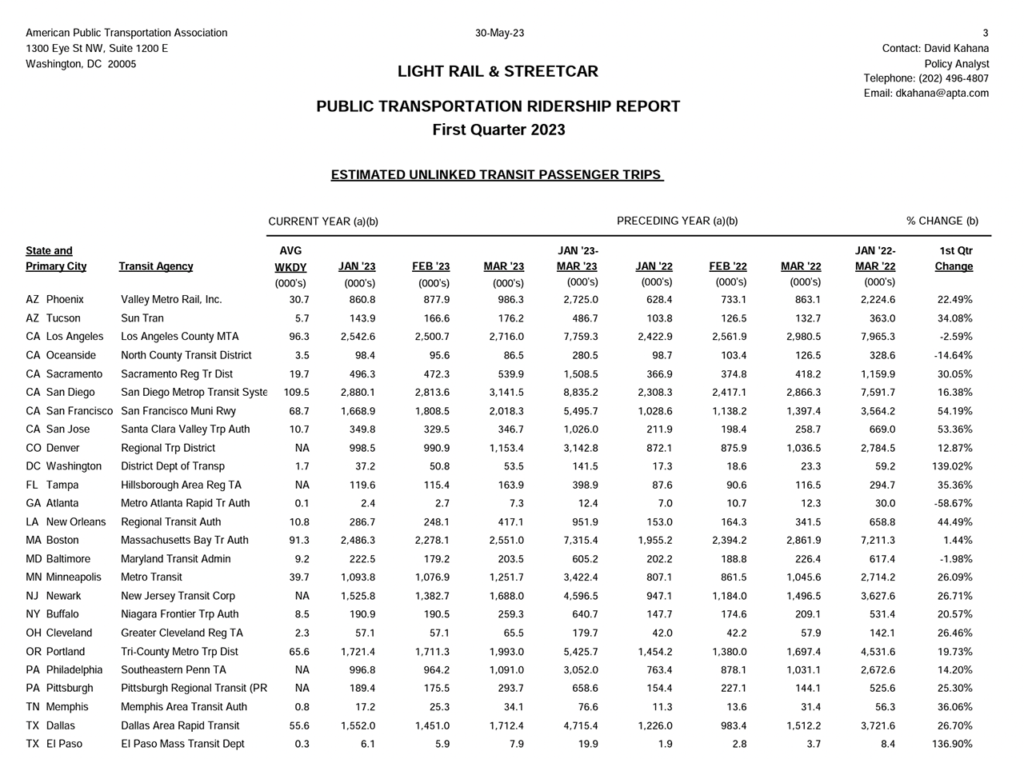
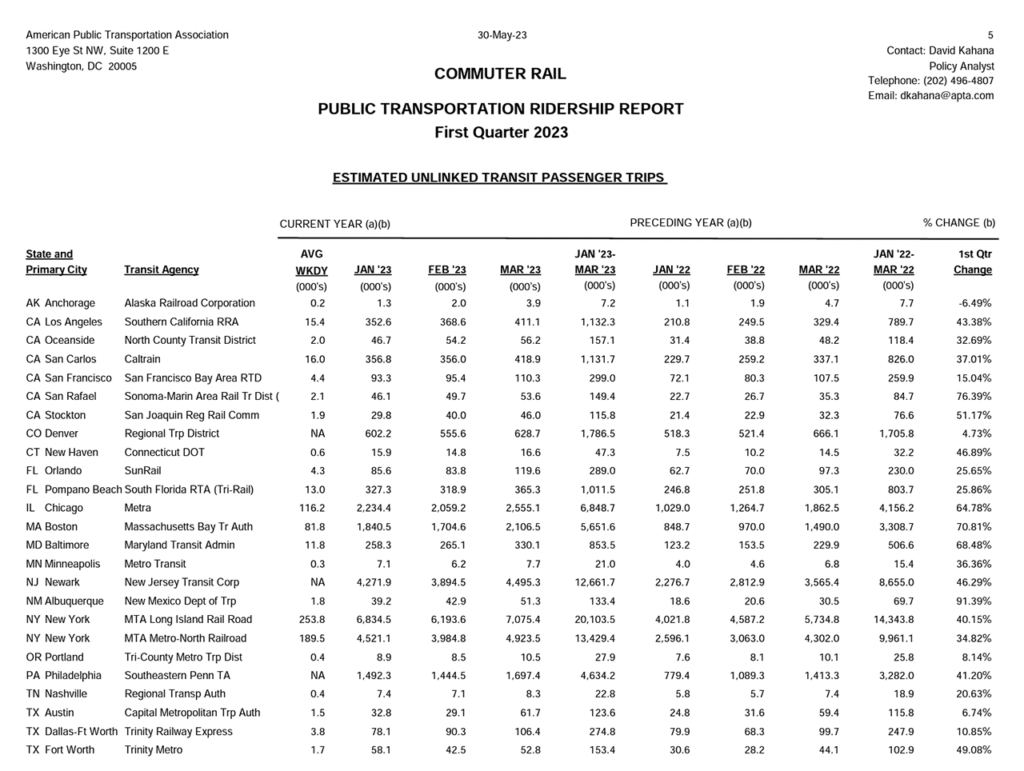
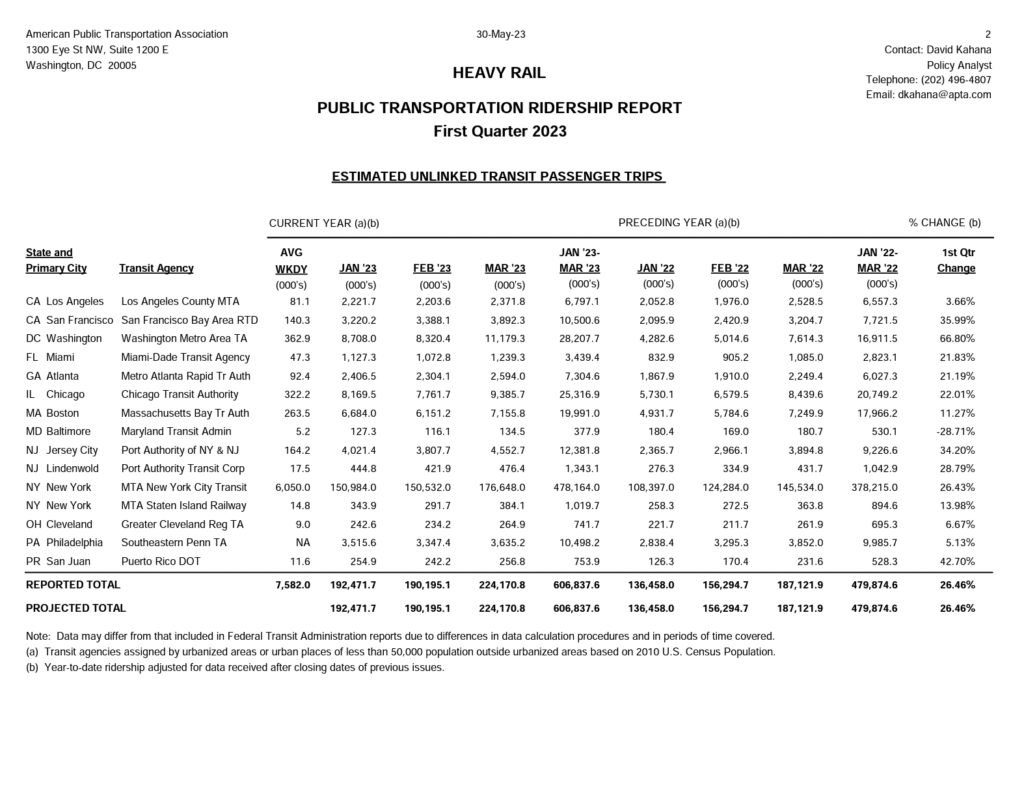
The American Public Transportation Association’s (APTA) first-quarter 2023 Public Transportation Ridership Report finds that the light rail/streetcar, commuter rail and heavy rail (rapid transit) categories were up by double-digits over the prior-year period. Among the agencies posting the highest gains: D.C. Streetcar (light rail/streetcar; up 139.02%), Virginia Railway Express (commuter rail; up 113.90%), and Washington Metropolitan Area Transit Authority (heavy rail; up 66.8%).

Among the agencies with the most modest gains for the three months ended March 31, 2023, were Massachusetts Bay Transportation Authority (light rail/streetcar; up 1.44%), Denver (Colo.) Regional Transportation District (commuter rail; up 4.73%), and Los Angeles County Metropolitan Transportation Authority (heavy rail; up 3.66%).


Utah Transit Authority (light rail/streetcar), Alaska Railroad Corporation (commuter rail) and Maryland Department of Transportation Maryland Transit Administration (heavy rail) were among the agencies with ridership drops from the same period last year; they were down 4.01%, 6.49% and 28.71%, respectively.


The Public Transportation Ridership Report (download first-quarter 2023 below) is a quarterly report of transit passenger ridership for U.S. and Canadian transit agencies, according to APTA. The report includes quarterly and year-to-date estimated unlinked transit passenger trips for the current and previous year by transit mode. Unlinked passenger trips are defined as the number of passengers who board public transportation vehicles, APTA reported on its website; passengers are counted each time they board vehicles no matter how many vehicles they use to travel from their origin to their destination. Additionally, agency specific ridership is provided for participating transit agencies.

“For the rail systems (heavy rail, light rail, commuter rail and trolleybus) that do not report data for the current quarter, it is assumed that the percentage growth for a missing agency or agencies is equal to the percentage growth for the entire category,” APTA reported. “The national percentage increase for the category is applied to stored data values for any missing agencies in that category and the total estimated count is reflected in the ‘Projected Total’ line on each category page. Responding rail agencies represent 99.9% of ridership in those categories.”
Bus agencies are sorted into population groups based on the population of the urbanized area (UZA) that they serve, according to APTA. “The ridership numbers for the quarter for these population groups are calculated by taking ridership data from the National Transit Database (NTD) and extrapolating it for the entire population group using the percentage change in ridership experienced by agencies in the population group that reported data to APTA as a base,” the association reported.
Data for Canadian agencies is not projected, APTA said; only the total for agencies that reported to APTA for the quarter is shown on the summary page.


