Commentary
Clear Evidence: Near-Zero PSR Service Improvements
Written by Jim Blaze, Contributing EditorLet’s admit it, and fix the expectation: U.S. Class I railroads have not experienced robust service recovery. Yet railroad optimism and expectations of satisfied customers persists. Why?
If you examine the simple shipper service report cards, there is zero evidence of continuing quality improvement from the so badly misnamed Precision Scheduled Railroading model. There is no defect-free scheduled customer benefit from the touted PSR model. Not across the U.S. And if the railroad boards of directors and senior executives had recognized it and just challenged themselves as to a fix, there would been no need for the current Surface Transportation Board oversight hearings in Washington. But there are hearings, set up because of clear service failures by the carriers.
Here is a core problem: Asking regulators to adjudicate a solution for railroad company failures is a bad formula. Why bad? Because regulatory requirements when promulgated set at best “minimum standards.” Regulators don’t try in most instances to even pretend that their regulatory orders are best-of-class solutions. They articulate that, as a group, the STB Commissioners are nervous about issuing such rules, asking the carriers instead to dig deep for a company set of solutions.
Need a raw example? FRA safety regulations for track structure set minimum construction and geometry tolerances for poor track. Anybody who builds or maintains the tracks to those minimum defect requirements is a poor planner or engineer. The same is true for buying tires. Who buys a brand that advertises minimum tread depth?
MISMATCHED EXPECTATIONS
Fundamentally, the promotional language about the value of E. Hunter Harrison’s advanced marketing slogan business model name (admitted to several years ago by the CEO of the first PSR advocate, CN) continues to suggest near-zero-defect deliveries of railroad cargo. Precision is a classic misnomer. It ought to be trashed.
The defect rates being added up by two of the PSR railroads are the report cards we have all been seeing but ignoring. The report cards for car movement performance (trip performance) have been publicly reported for about three years now—reporting even directly to investors, who collectively seem to ignore the implications of bad marks.
How can these failures to achieve anything like mathematically possible good service levels be ignored for so long? Nearly three years is about a thousand days of going to work as if blindfolded. How can you oversee an organization that way?
This is not the first time that Railway Age’s editors have addressed this poor service problem. It’s not an issue. It’s a problem that could be at minimum improved and by a few true leaders resolved to correct the trip performance failures.
Briefly, let’s review the scorecard performance records from CSX and Union Pacific. As we do, let’s respect them for continuing to publish their records. Given their low scores, that’s pretty gutsy. That openness suggests to an old-timer like me that there is a credible path ahead to correct and improve what’s gone wrong with car and their intermodal trip plan performance. Indeed, let’s acknowledge that improvement possibility as a first pivotal step.
CSX
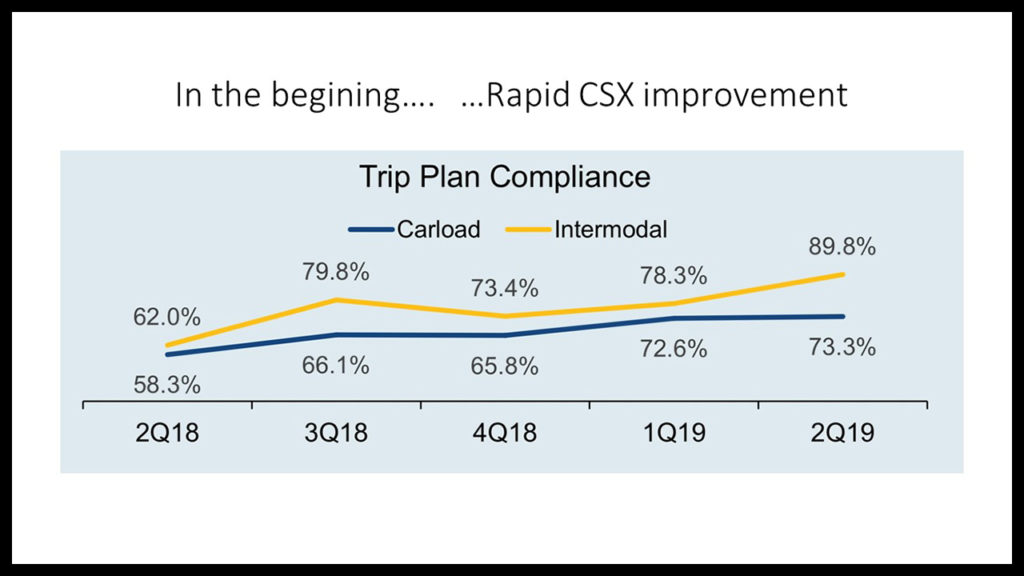
CSX argues that its service delivered performance is getting better. As measured by trip plan compliance (CSX calls it TPC)—as the success in meeting end-to-end customer commitments based on estimated times of arrival—CSX’s service performance at the carload level had actually statistically improved initially from the low-60% range to the mid-80% range. From a CSX quarterly investor presentation:
But then, carload delivery performance seemed to “revert to the old mean.” This tells a different tale:
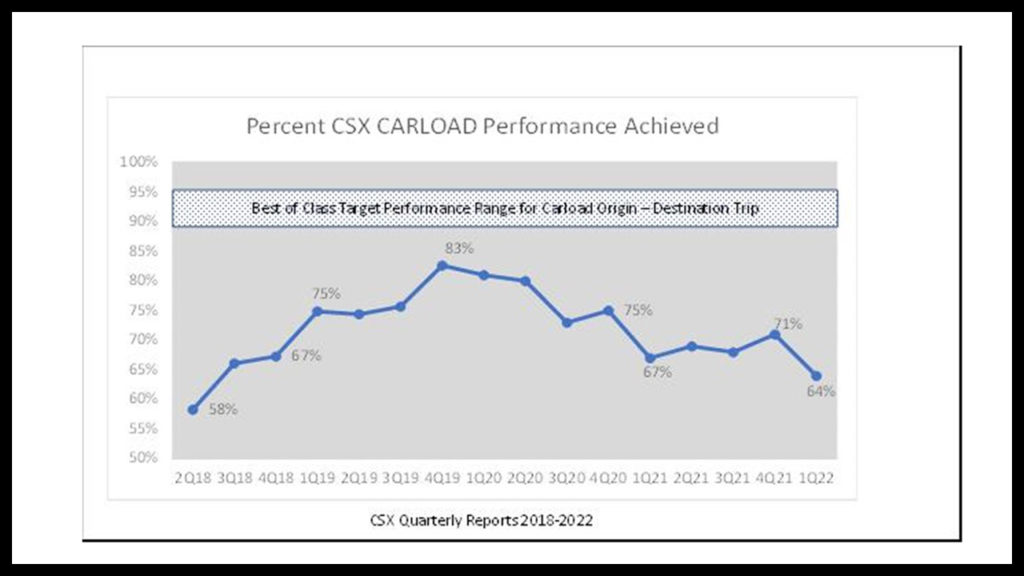
Between the second quarter of 2018 and the fourth quarter of 2019, CSX carload freight showed remarkable and near-constant improvement in reliable delivery, from a woeful 58% average to an impressive 83% delivery pattern. Then, something went wrong. There was a near-constant reliability failure pattern except for the fourth quarter of 2020. Throughout 2021, CSX carload performance experienced a hovering-like line slope in the relatively poor 67% to 71% range–and then into 2022 dropped below the third quarter of base year 2018 delivered performance.
That is evidence of a failure to perform as expected. And it was not really explained in the STB hearings of April 26-27 2022 to anybody’s satisfaction, other than perhaps an admission that CSX cut its reserve work force to the bone in the attempt to maintain investor returns. Is that the answer?
If PSR was actually a world-class customer service business standard, then by the third to near-fourth year of deployment, professional railroaders would expect a performance in the best-of-class metrics of above the 80% level – and perhaps as high as the nominal mathematically possible delivery range of 88% and above as highlighted by the notation area shown in Figure 1.
Why? How’d that happen? And then stay there so long, for about two full years?
By now, CSX trip planning models and spreadsheets must be on their fourth or more iteration. One would therefore expect a continuing improvement. But for carload, that’s not happening. Yet, when it is reported quarter after quarter for so long a time, no investor representatives seem to challenge management. Has the CSX board of directors CSX management about the line pattern? Hard to tell.
In the meantime, CSX continues its “executive speak” asserting that “Shippers have reacted positively to TPC, particularly the transparency it provides on service reliability.” Really? Then why these STB hearings and the continuing news reports suggesting otherwise?
On another note, CSX intermodal presents a slightly different performance record:
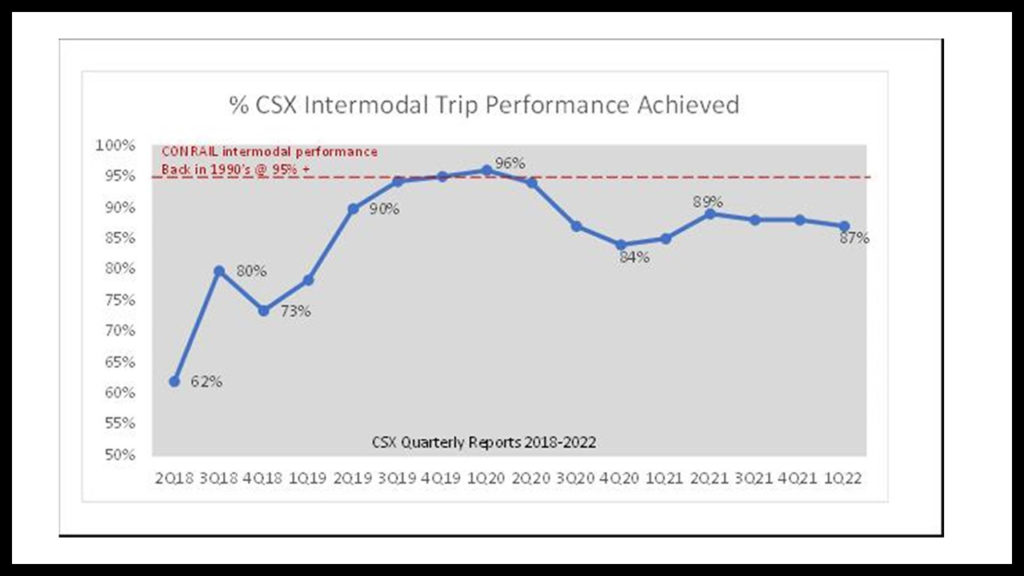
CSX’s intermodal trip performance under introduction of its U.S. PSR business model (previously widely used on CN and CP in Canada) demonstrated a remarkable rapid improvement. Note the upward slope of the graph line from the really poor 62% performance to 96% in just seven quarters. Yes, impressive.
But this was followed by three quarters of a drop into the so-so mid-80% percent range by fourth-quarter 2020, followed by three quarters of slight improvement toward the just-under 90% mark, then a three quarters lag into a mediocre standard of about 87% in the recent first quarter of 2022. Again, there is no continuous quality improvement displayed in PSR results.
Now, if CSX’s model was world-class, then what should we have expected? They by now should have matched Conrail’s early benchmarks. Three decades ago, Conrail’s version of “paper copy train schedules” were much more reliable than Figure 3’s CSX intermodal record. Why is that? Why isn’t it recognized as very different by CSX officers and outside investors?
When challenged, CSX should have an answer to give to the STB. After all, CSX claims that it has now superior data analytics, possibly the best of all seven Class I’s. And it has the raw data from which to illustrate how to build and retain customers’ business because CSX’s new tools allow it to position itself as a “solution architect.” That is selling position.
By now, I’d expect CSX to have between a 90% to at least 96% range of intermodal performance if their business model was actually working as intended. Having no crew reserves is an awkward excuse when intermodal was supposed to be its engine of volume and truck-stealing traffic growth. Reserves are both a basic military supply chain and a strategic SWOT principle when seeking such growth, correct?
UNION PACIFIC
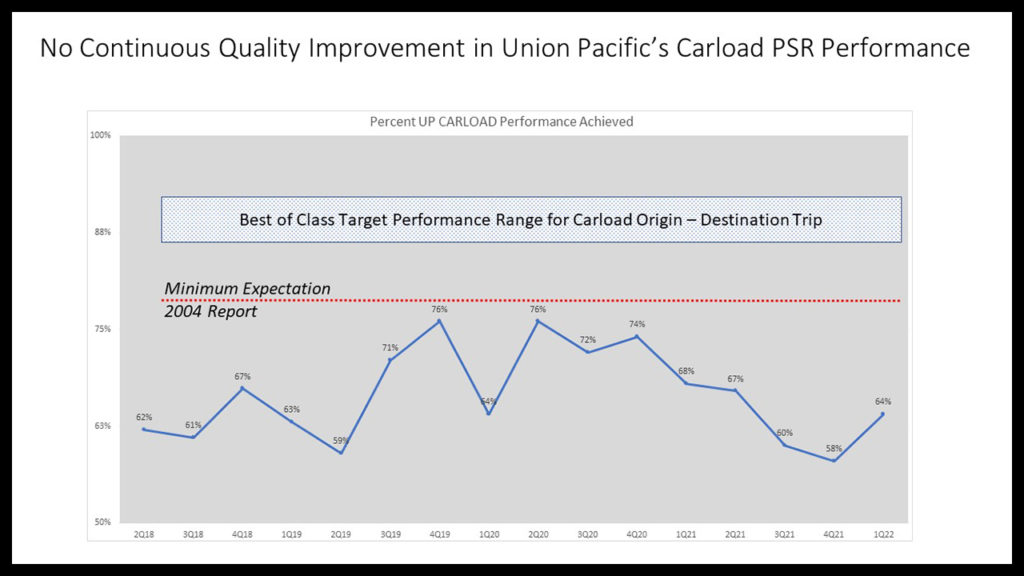
After CSX, Union Pacific was the next to join the U.S. PSR bandwagon. Figures 4 and 5 identify its results. The visual pattern contradict arguments for PSR service benefits to customers.
Railway colleagues, these have been publicly available data, reported each quarter, but not always repeated as a sequential timeline of record, unless you examine third-party logistics presentations by groups like FTR and SFG. Those are subscription sources.
Railway Age has periodically shown similar graphs, but here we take the patterns out over the longer near-four-year trend line.
Union Pacific’s saw-tooth up and down Carload trip performance suggests that there may be no correlation statistically with its implementation of its version of the PSR business model. The fourth quarter of 2021–if computed correctly by UP staff–is an embarrassing 58%. That’s below its startup period dated the third quarter of 2018. If UP was performing as many railroad operations simulation researchers would have expected by now, its carload business should be in the 80% to 88% range–or higher if its model was a superior tool.
Some of us old-time strategic business planners have seen these kinds of of delivery stumbles before, as during the UP/Southern Pacific merger and later-on during the Conrail operational split between CSX and Norfolk Southern in the 1999-2001 period. Crew and power shortages were later proven to be the reasons. How did UP and CSX manage to lose that institutional knowledge base? It was likely predictable going into 2020. This kind of pattern is management failure—not one that can be blamed on the unions.
How about Union Pacific’s intermodal trip performance? Figure 5 tells that tale.
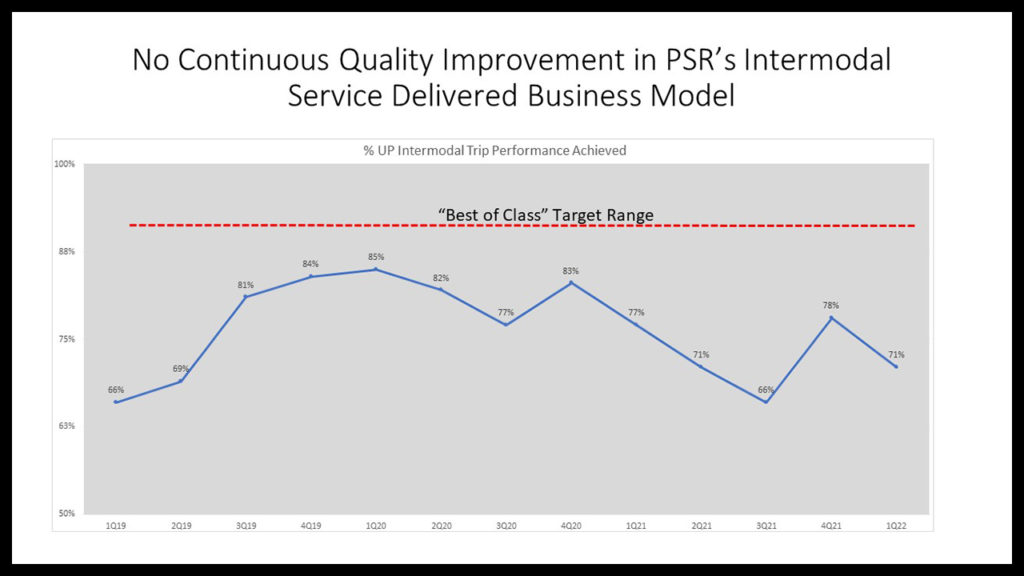
The pattern shows that Union Pacific, like CSX, had a surge in intermodal performance early on between the 66% poor service quality of base year 2019’s first quarter into 2020’s first quarter. Then there was a stall period dropping toward 75%, then a longer three-quarter stall into the mid-60% range to where it started back in 2019. UP never hit the sweet spot above the 90% range for intermodal. It at best was about ten points worse than the best Class I performance targets that others in the past have reached. If UP’s board and Wall Street investors had challenged the executive suite during these quarterly reports, very likely we all would have avoided an STB investigation.
The assertions the railroads have been repeating following PSR’s “good news hypothesis” are a list of repeating claims still accessible in Class I investor presentations. Unfulfilled to date for many customers, these expectations have been touted multiple times. They are actual quotes from PSR rail freight advocates:
- “Deliver a Highly Consistent and Reliable Service Product.”
- “Focus on Highly Consistent and Reliable Service Product.”
- “Full Implementation by Mid-2019” or 2020.
- “Shifting the focus of Class I rail operations from moving trains to moving cars.”
- Performance metrics improving sequentially.”
Did this happen to the railroad shipper and to the national economy as benefits beyond the railroads’ income statement and balance sheet? That’s tough to prove.
- A PSR railroad like CSX might not be cyclical in its traffic pattern! Interpretation is that often now under PSR, CSX might not be subject to boom and must cycles of operations. That doesn’t seem to be proven yet. It’s an argument advanced. Needs some fact checking.
- By focusing on efficiency, CSX took work out of the process that was not necessary to move customer product. They took work and noise and activity out of the process–as efficiently as a railroad could. To a large extent, that is internally true for the company CSX. But did it result in less processing work for CSX customers? Not according to STB testimony.
- CSX now can benefit by retaking much of the lost decades of traffic from the highways with its lower cost to operate service. Really? I have been reading about this share capture for more than a decade now. Show me the results, please. It’s a pro forma target announcement, not yet achieved. This should be a warning.
Objectively, it is standard business practice to put your best marketing and sales message out into the market. But these sales pitches need to be vetted. I agree that both CSX and Union Pacific now might indeed be a better internally functioning railroad organization than before the PSR model showed up—but by how much from a customer’s perspective?
BEST-IN-CLASS TARGETS
Let’s close my independently offered economic commentary by reflecting on what operations analysts consider to be achievable. Simple business simulations of practical train and car level flows across a network of origin nodes and connecting links and some simple “time friction math” allows this kind of pro forma outlook.
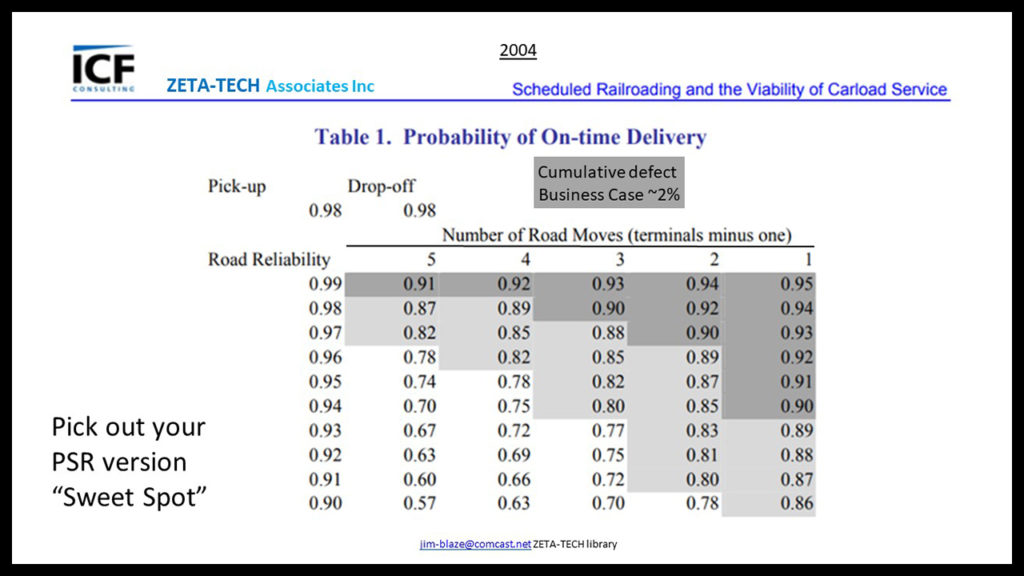
Figure 5 is the simple matrix-like projection of the targeted performance results for carload freight. I could make the case study more complex, but here I am just trying to outline how networks handle defects across their links and nodes. Here, the business case assumes that you have a pretty good schedule with no more than about a 2% error (delay) in your service at any one friction point.
In the FRA-published ICF and Zeta Tech Associates report from 2002-04, you can clearly see that a carload movement across two terminals ends up with just a near 92% on-time predictable reliability. Expand that network to a movement across or through four terminals and the probable on-time final delivery of carload cargo drops to about 89% as promised. Thus, the 2% origin pickup and 2% destination delivery segments are assuming a near-perfect main trunk line 2% error rate (98% on time).
Drop the main network reliability to a 5% error (defect rate for whatever combination of reasons), and the probability of a on-time delivery by carload hits a near-75% target range. That’s a 25% error of the day delivery was promised. Colleagues, what PSR railroad is hitting these higher targets? If we examine the reasons for success, we do not need the STB to issue far-reaching new regulations. So, who’s leading that R&D effort?
Figure 6 is from the FRA Scheduled Railroad Report, 2004. Limited circulation, but available on the Internet with selective searching. Authors: Eric Bershers, Randolph Resor and Jim Blaze. Sponsor: Office of Policy, FRA:
WRAP UP
There is science, math and indeed even multiple operational and marketing hypotheses that still can be tested about different ways to use discipline to produce more productivity and benefits to rail freight as we use this mature technology throughout North America.
But mark these words, please: PSR by whatever definition you choose to give it in wording is not the first attempt to increase productivity. Need proof? Check out the easy-to-read and fully illustrated (on Dec 3, 2021) William Hay Railroad Engineering Seminar slide presentation authored by Carl D. Martland, the Senior MIT Research Associate. He has a big stash of railroad technical writing to his credit. Martland describes in easy-to-read style the productivity improvements and the immense financial and market share loss challenges that the railroad industry overcame between 1960 and 2010—evidence that shows how the PSR model was not the first attempt to resuscitate and improve the rail sector.
Engineering and economics combined to demonstrate that bigger trains worked before. But in that timeline, the trains were heavier at the axle loading and steel wheel to head-of-rail contact points, as illustrated here:
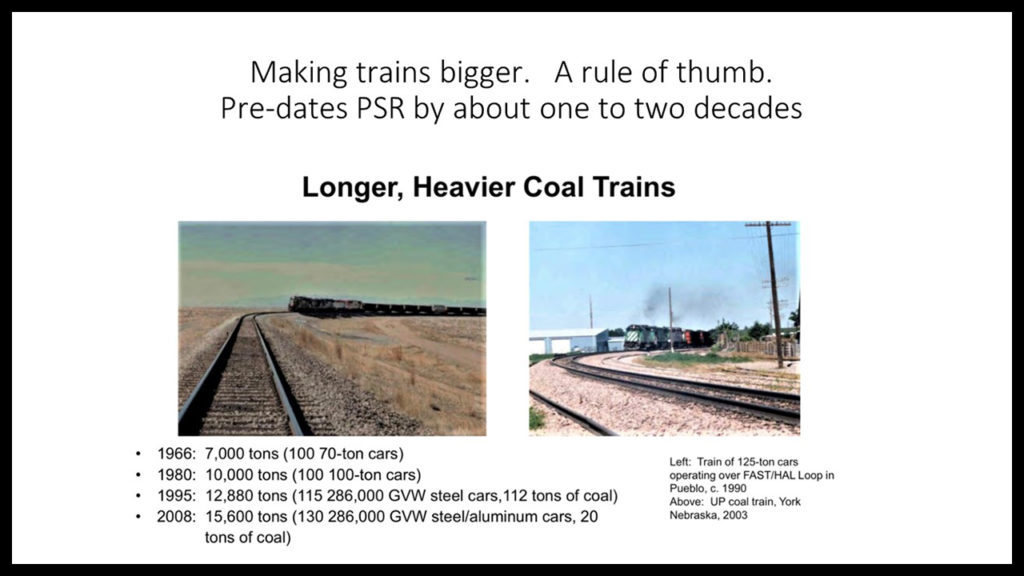
Longer PSR-generation trains are really not a new process or invention. We have seen this principle before. But to make heavier axle loads work, the railroads first improved the steel rail size and hardness and improved the depth of ballast and the supporting crossties and the bridges and turnouts (switches).
Translation: The previous generation of railroaders and their boards of directors invested large sums of capex for definitive betterment or functional added asset capacity to their balance sheet. The PSR generation seems to go about adding passing siding lengths over a much longer “we will get to it” later” approach. That didn’t work out too well in western Canada a few years back as CN ignored the well-understood coming traffic forecast out of Prince Ruppert.
The balancing is that growth gets funded rapidly rather than instead of rapidly paying dividends and buying back stock as the corporations’ financial engineering priority. That, to this old economist directly familiar with the engineering requirements and the cost of delaying, is the core of the balancing question, the public service focus of being a common carrier.
To the STB Commissioners, I recommend this body of slides for your review as you consider your available tools in your current oversight role. Consider, if you will, that some of what you decide could be offered as a pilot testing of new service requirement balancing, rather than permanent changes. After all, the scientific method often involves a pattern of test and failure before success is discovered. Doing nothing is not in any party’s interest.
Consider as your debate just for a moment your oversight options, the essential, often-forgotten deliverable of the railroad entrepreneurs’ favorite legislation, the Staggers Rail Act, which produced a balance of benefits among the railroad companies under duress at the time and their customers.
Also please consider these next two slides by Mr. Martland:
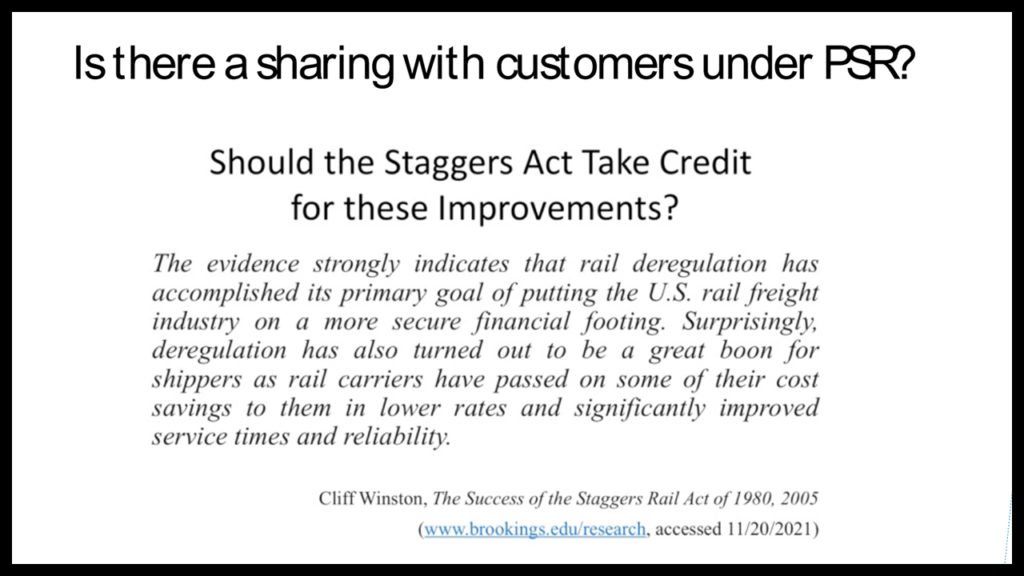
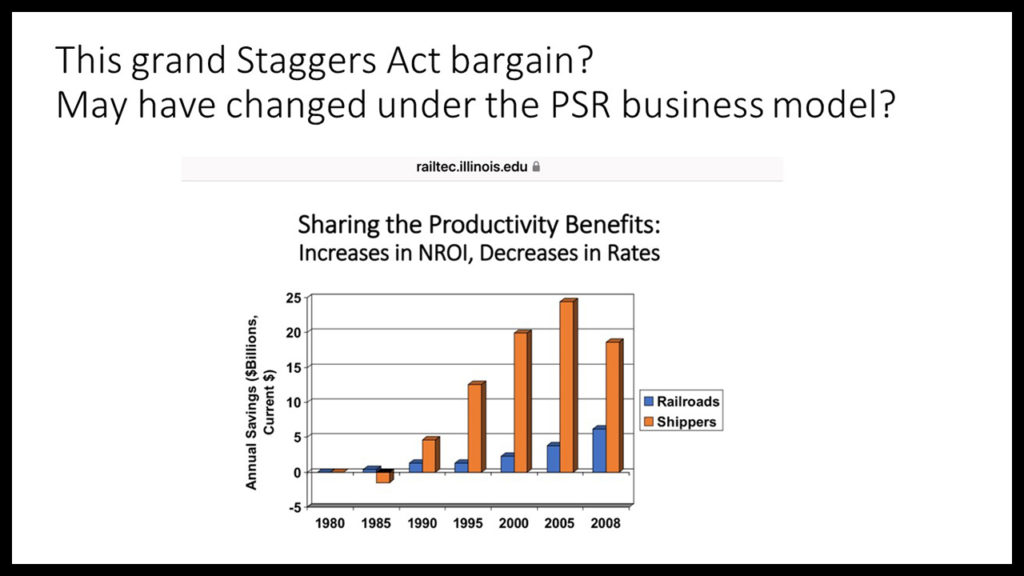
Can you say, Wow! Look at those shipper Staggers benefits!
Shouldn’t PSR shippers be receiving by now the benefits rai executives proclaimed were coming? Shipper logistics cost benefits have been promised–but not yet delivered. Is that not a litmus test of fairness, a sharing as with the Staggers Rail Act? Or does this require new legislation? Now if true, that might really open up the question of reregulation. Why not instead try business negotiated solutions, using the STB as a broker or even an arbitrator?
In closing, this message is to the rail-freight-besieged user community: Shippers and receivers by rail, check your own supply chain railroad-delivered records. You have the makings of your own score card evidence. You need to consider entering it into the public STB hearings as public record in a well formatted manner. Get an economist to help you.
As always, Railway Age and I welcome contrary opinions and supporting evidence. That is part of wanting the railroads to succeed. There are published works about railroad operations simulation and pro forma business case evaluations to be considered. Maryland and Van Dyke are two such authors for recommended reading. Studies dating into the 1980s would have involved experts like Alain Kornhauser of ALK and Chuck Hoppe at Booz Allan. In addition to his departed FRA study co-authors, Jim recommends reading others works by Larry Ratcliffe and Kant Rao.

Independent railway economist and Railway Age Contributing Editor Jim Blaze has been in the railroad industry for more than 40 years. Trained in logistics, he served seven years with the Illinois DOT as a Chicago long-range freight planner and almost two years with the USRA technical staff in Washington, D.C. Jim then spent 21 years with Conrail in cross-functional strategic roles from branch line economics to mergers, IT, logistics, and corporate change. He followed this with 20 years of international consulting at rail engineering firm Zeta-Tech Associated. Jim is a Magna Cum Laude Graduate of St Anselm’s College with a master’s degree from the University of Chicago. Married with six children, he lives outside of Philadelphia. “This column reflects my continued passion for the future of railroading as a competitive industry,” says Jim. “Only by occasionally challenging our institutions can we probe for better quality and performance. My opinions are my own, independent of Railway Age. As always, contrary business opinions are welcome.”