U.S. Rail Traffic: ‘A Mix of Red, Yellow and Green,’ AAR
Written by Marybeth Luczak, Executive Editor
“As conjecture grows about the direction of the U.S. economy, June rail traffic doesn’t offer definitive answers on whether a recession is looming or not,” Association of American Railroads’ Senior Vice President John T. Gray reported on July 6.
“Like many other economic indicators today, rail traffic is a mix of red, yellow and green, with some traffic lines, such as automotive, providing generally positive indicators, while others, such as chemicals, being a bit more subdued than they were earlier in the year,” Gray noted in the AAR traffic report for June 2022 and the week ending July 2, 2022.
U.S. Class I railroads hauled 1,157,555 carloads last month, down 1.5%, or 17,970 carloads, from June 2021; and 1,323,119 containers and trailers, down 4.6%, or 63,483 units. Combined U.S. carload and intermodal originations in June 2022 came in at 2,480,674, down 3.2%, or 81,453 carloads and intermodal units from the same month last year.
In June 2022, eight of the 20 carload commodity categories tracked by the AAR each month saw carload gains compared with the same month last year. These included crushed stone, sand and gravel, up 7,028 carloads or 7.3%; grain, up 4,794 carloads or 4.5%; and motor vehicles and parts, up 3,839 carloads or 6.2%. Commodities that saw declines in June 2022 included coal, down 10,226 carloads or 3.1%; all other carloads, down 7,532 carloads or 23.1%; and primary metal products, down 5,388 carloads or 11.6%.
Excluding coal, carloads were down 7,744 carloads, or 0.9%, in June 2022 from June 2021. Excluding coal and grain, they were down 12,538 carloads, or 1.7%.

Traffic for the previous three months was similar, as were Gray’s accounts of it:
• “Rail traffic volumes in May reflected an economy that is a mixture of good and not-so-good,” Gray pointed out in a June 1 AAR traffic report. “Auto production and auto carloads seem to be slowly recovering; crushed stone and sand, and food-related volumes are showing strength while intermodal had its best month since June 2021. On the other hand, carloads of chemicals fell for the first time in more than a year in May, while grain volumes continued to be disappointing when compared to those of 2021 and the latter half of 2020.”
• “U.S. rail traffic in April had something for everyone,” Gray reported on May 4. “Optimists can point to autos, chemicals and scrap, all of which had solid gains [over the same period last year]. Pessimists can point to grain, intermodal and petroleum products, which saw significant declines. In the middle are carloads of industrial products—an aggregation of seven key carload categories—which fell slightly in April, consistent with the most recent GDP numbers.”
What was happening in June 2021, June 2020 and June 2019? Let’s review:
• U.S. rail volumes in second-quarter 2021 “reflect an economy that is in much better shape than it was but still has room to grow,” Gray reported on July 7, 2021. In the second-quarter, total U.S. carloads were the highest since fourth-quarter 2019; carloads excluding coal were the highest since third-quarter 2019; and intermodal and chemical volumes were “both the highest for any quarter in history,” Gray noted. Additionally, carloads of steel-related commodities were “relatively strong in the second quarter, reflecting higher demand as the industrial economy continues to recover,” he said. In June 2021, U.S. railroads originated 1,175,232 carloads, rising 19.1%, or 188,164 carloads, from June 2020, while they originated 1,386,745 containers and trailers, increasing 10.9%, or 136,634 units. Combined, June 2021’s originations came in at 2,561,977, up 14.5%, or 324,798 carloads and intermodal units from June 2020.
• “June [2020] was a month in which the slow recovery process that began in early May [following the start of the pandemic], began to accelerate,” reported Gray in a July 1, 2020 AAR traffic report. “By the end of June [2020], freight loadings had improved by about 60,000 carload and intermodal units weekly over where they had been in late April.” U.S. railroads originated 794,256 carloads in June 2020, down 22.4%, or 228,975 carloads, from June 2019. U.S. railroads also originated 1,004,933 containers and trailers in June 2020, down 6.6%, or 70,994 units, from the same month last year. Combined U.S. carload and intermodal originations in June 2020 were 1,799,189, down 14.3%, or 299,969 carloads and intermodal units from June 2019.
• “June [2019] marked the fifth straight monthly decline for total U.S. rail carloads and for U.S. intermodal traffic,” Gray reported on July 3, 2019. “Manufacturing is responsible for much of the rail traffic base, but U.S. manufacturing output has been falling for several months. Housing, too, is in the doldrums, and trade is suffering because of tensions with trading partners overseas. Taken together, demand for rail service just isn’t as strong as it was six months or a year ago. Obviously, railroads hope things turn around, both for their own sake and for the sake of the broader economy.” U.S. railroads originated 1,023,394 carloads in June 2019, down 5.3%, or 57,173 carloads, from June 2018. U.S. railroads also originated 1,075,974 containers and trailers in June 2019, down 7.2%, or 84,002 units, from the same month in 2018. Combined U.S. carload and intermodal originations in June 2019 were 2,099,368, down 6.3%, or 141,175 carloads and intermodal units, from June 2018.
Year to Date 2022
Total U.S. carload traffic for the first six months of this year came in at 5,993,917, down 0.1%, or 8,823 carloads, from first-half 2021; and 6,878,726 intermodal units, down 6.2%, or 453,282 containers and trailers.
Total combined U.S. traffic for the first 26 weeks of 2022 was 12,872,643 carloads and intermodal units, a 3.5% dip from last year.
Week 26 (Ending July 2, 2022)
Total U.S. weekly rail traffic was 500,285 carloads and intermodal units, down 2.5% compared with the same week in 2021.
This is the 19th consecutive week that total traffic has declined. (Total traffic gains were last seen in Week 7, which ended Feb. 17, 2022.)
Total carloads for the week ending July 2, 2022 came in at 234,561, down 1% from the same week in 2021, while U.S. weekly intermodal volume was 265,724 containers and trailers, down 3.7% from last year.
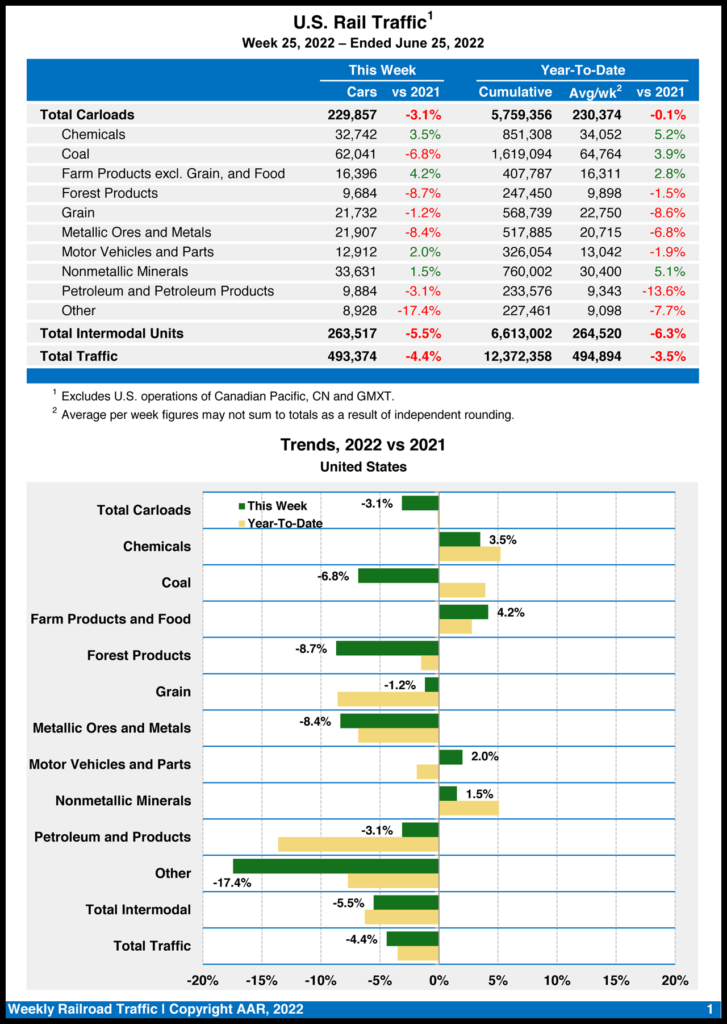
Four of the 10 carload commodity groups posted gains compared with the same week in 2021. They included grain, up 3,040 carloads, to 22,904; farm products excluding grain, and food, up 743 carloads, to 16,287; and nonmetallic minerals, up 219 carloads, to 32,506. Commodity groups that posted declines included coal, down 2,003 carloads, to 64,375; miscellaneous carloads, down 1,843 carloads, to 9,011; and metallic ores and metals, down 1,113 carloads, to 22,159.
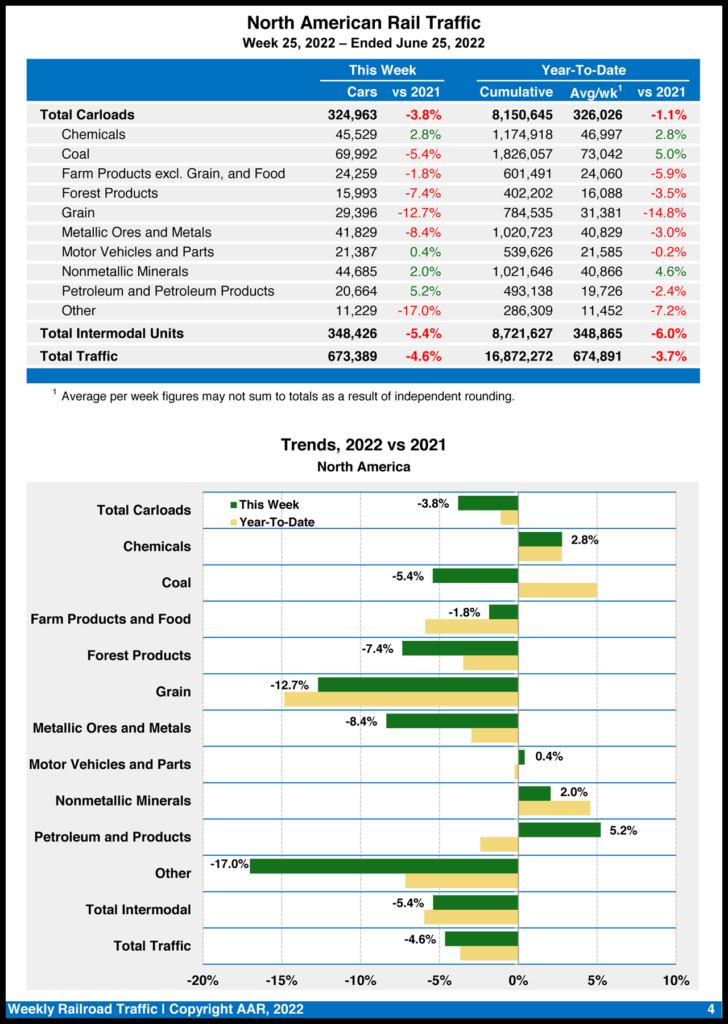
North American rail volume for the week ending July 2, 2022, on 12 reporting U.S., Canadian and Mexican railroads totaled 330,619 carloads, down 0.4% from the same week last year, and 350,823 intermodal units, down 1.5% compared with last year. Total combined weekly rail traffic in North America was 681,442 carloads and intermodal units, down 0.9%. North American rail volume for the first 26 weeks of 2022 was 17,553,714 carloads and intermodal units, down 3.6% from 2021.
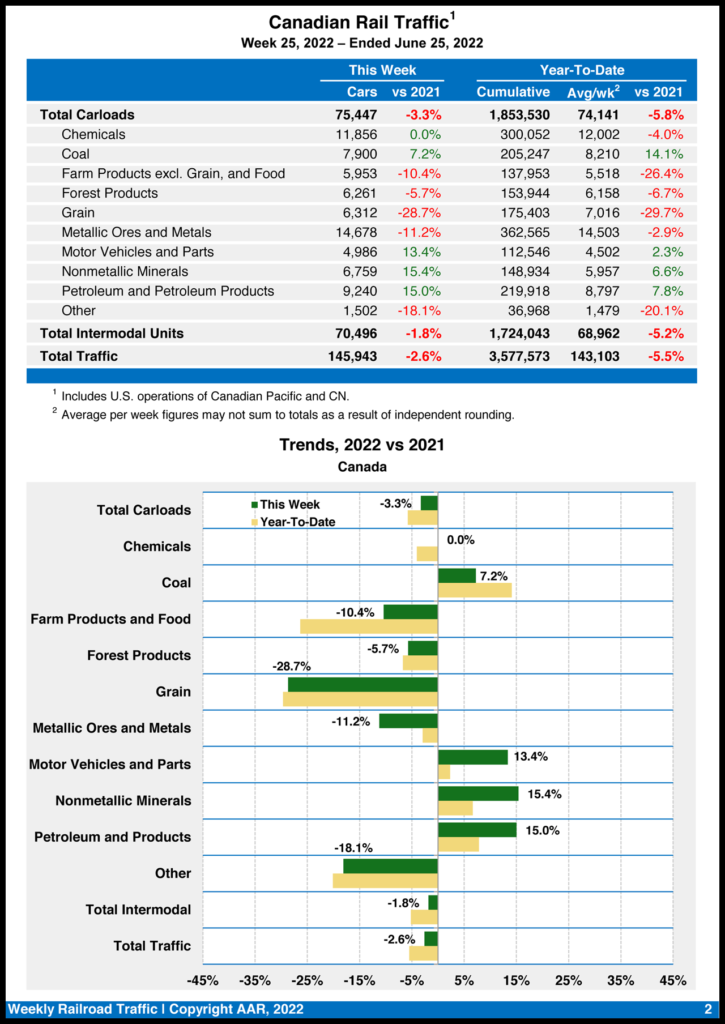
Canadian railroads reported 76,963 carloads for the week, up 5.7%, and 69,631 intermodal units, up 8.8% from the same week in 2021. For the first 26 weeks of 2022, they reported cumulative rail traffic volume of 3,724,167 carloads, containers and trailers, down 5.1%.
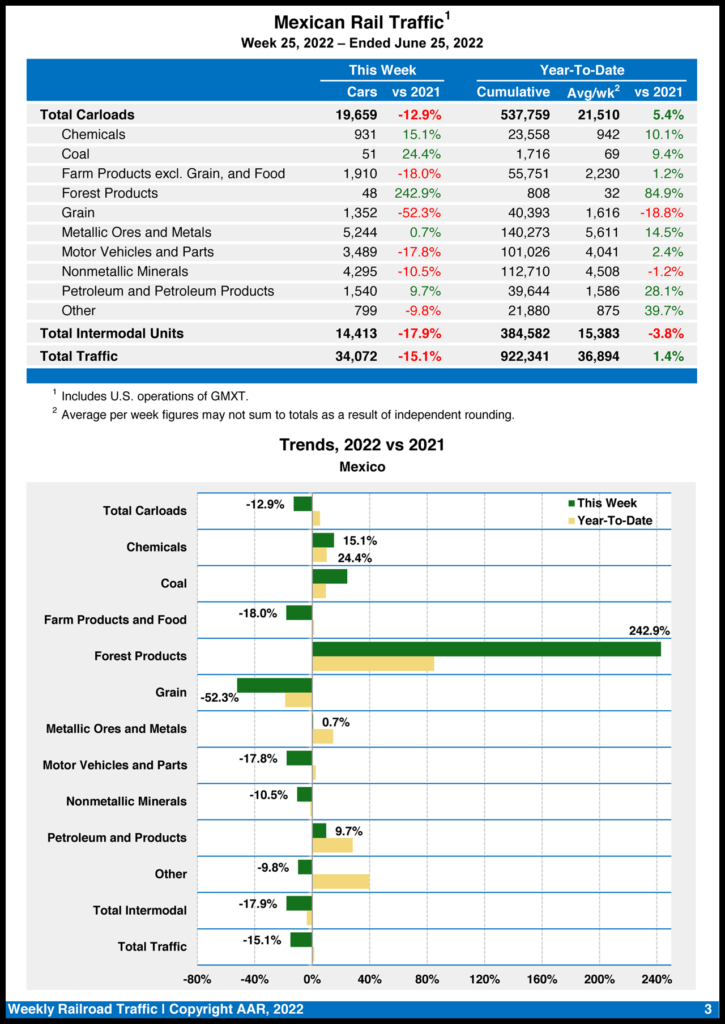
Mexican railroads reported 19,095 carloads for the week, down 13.1% vs. the same point in 2021, and 15,468 intermodal units, down 4%. Their cumulative volume for the first 26 weeks of 2022 was 956,904 carloads and intermodal containers and trailers, up 0.9% compared with last year.