Commentary
Arctic Blast Was Brutal
Written by Rick Paterson, Managing Director, Loop Capital Markets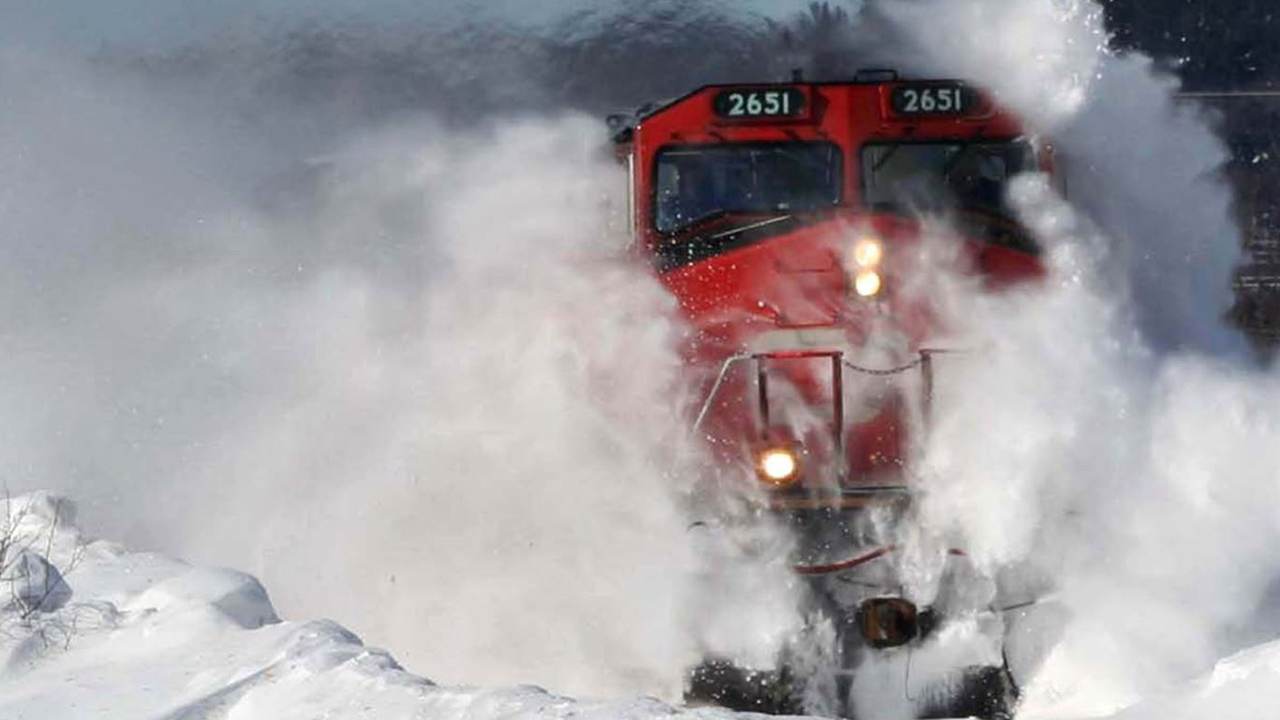
Association of American Railroads
The Arctic Blast has been our singular focus over the past few weeks, starting with foreboding anticipation, then some historical context, and we’ve now reached the quantifying the damage stage.
Here it is:
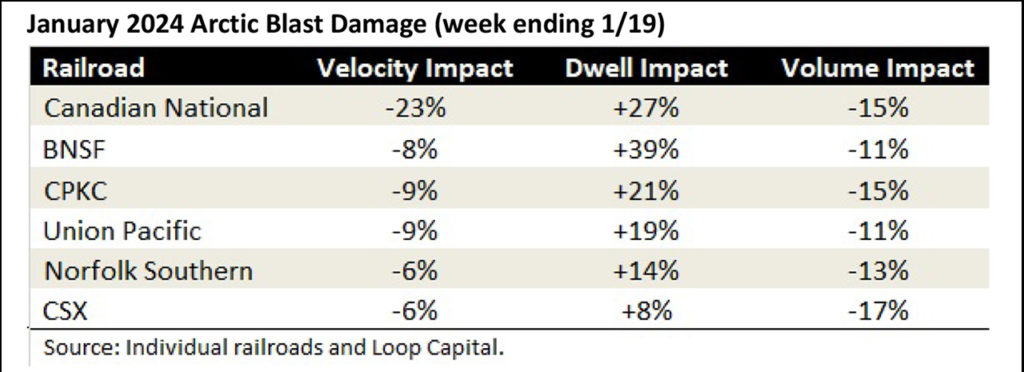
The extreme cold snap primarily fell in the reporting week ending Jan. 19, and the table above simply compares the metrics in that week to the one prior. It’s sequential, not YoY. It’s not overly scientific, but we think the picture it paints is accurate … and ugly for some. We’ve also ordered the networks by our view on the degree of operational damage on a full system basis, and “full system” has become an important caveat for the two Canadian railroads.
With the acquisition of Kansas City Southern, Canadian Pacific has become much more geographically diversified (there was no arctic air in Veracruz), which dilutes its full system numbers. If you removed KCS from the mix, CP’s velocity and dwell impact would no doubt be much closer to CN.
CN really took it on the chin here, and we’ll learn something from this event because the network recovery will be the first true test of the operating team since Ed Harris’s retirement. Time to earn those corner offices.
BNSF is the other network that took a big gut punch. The geographic footprint of the Arctic Blast clearly impacted the Canadians most, as usual, then the western U.S. railroads, with the eastern U.S. railroads challenged the least; albeit still significantly. Within the U.S. west, BNSF was materially more exposed than Union Pacific due to its extensive operations in northern Minnesota, the Dakotas and Montana, where UP has either no lines or a much smaller presence. In the table you can see that, while the velocity impact on BNSF and UP was within 1%, BNSF took a huge hit on terminal dwell, which jumped 39% to a high we’ve never seen, and we have data back to January 1999.
Cause for panic? No, and the reason we say that is because if you look at prior cold snaps. After the February 2021 Polar Vortex, for example, BNSF was able to normalize terminal dwell times in just two weeks. That might be optimistic this time around, but the point is that a horrendous dwell reading doesn’t automatically condemn the network to months of recovery time. A few weeks is more likely.
Expanding on that, it’s usually the loss of speed that’s harder and takes longer to recover, rather than normalizing yards and terminals (although of course the two are related). So, worry about velocity more than dwell, which again shifts the focus back to CN.
Finally, you can see the volume impact averaged 14%, which makes the QTD numbers look bad: UP –9%, BNSF –3%, CSX –6%, NS –6%, CN –10%, CPKC –13%. Rail volumes are only truly lost when they’re diverted to truck, which generally doesn’t happen with bulk in particular, so there should be some catch up volumes over the next couple of weeks. Don’t write off Q1 financial results just yet, but this event coupled with the continued soft freight economy is going to make it tough.
Next week we’ll start tracking the recovery.