
Commentary
Fixing Flawed RSTAC Metric Methods
Written by Rick Paterson, Managing Director, Loop Capital Markets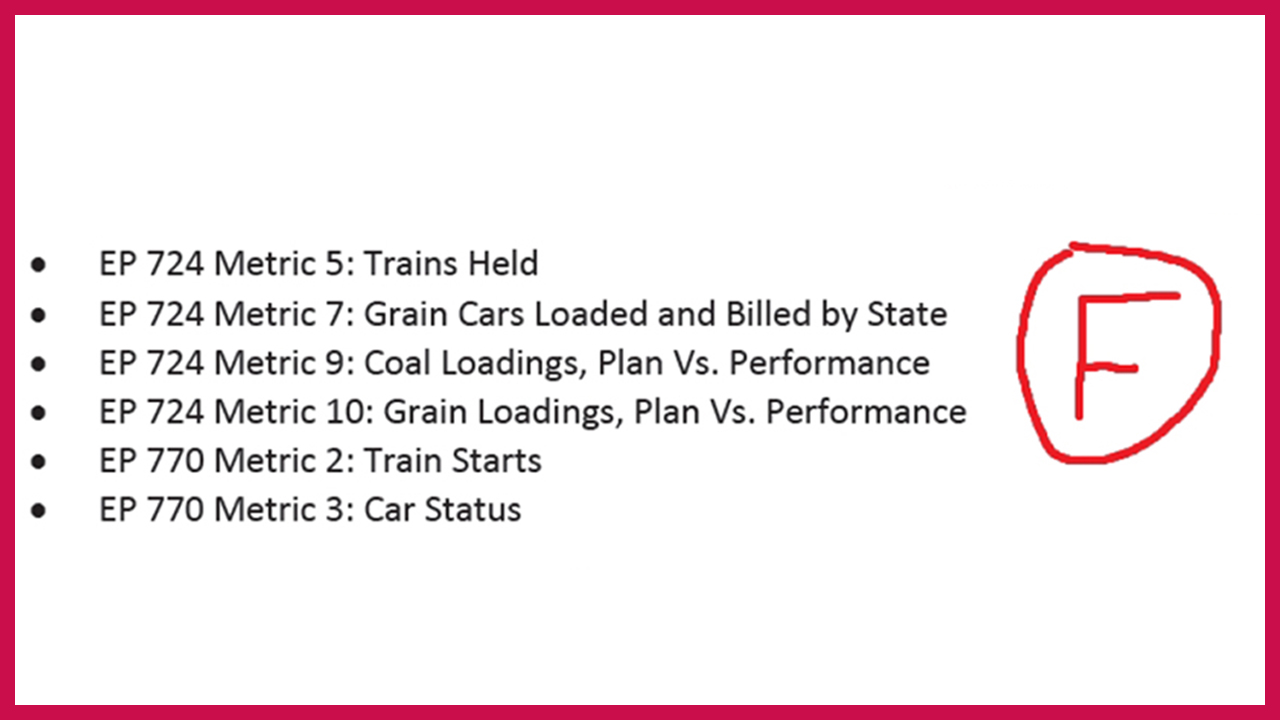
I’m always on the lookout for efforts that would change the dataset we’re using, and one is now on the horizon. The STB has three associated Stakeholders Committees, and one of them, The Railroad-Shipper Transportation Advisory Council (RSTAC), has a “Measures & Metrics” subcommittee tasked with making recommendations to improve the reported industry operating metrics.
Foundational to my weekly reports is a lot of data, most of which is collected and made public weekly by STB. All I’m essentially doing is generating charts and adding contextual text to make the data easier to digest and understand. While institutional investors were the original target audience, my distribution list has expanded to include railroad customers, regulators, legislators, plus the railroads themselves as it offers every operating team a constantly updated snapshot of how their primary competitor and the rest of the industry is performing.
RSTAC recommendations were put forward at a June 21 meeting, and the two-page list of suggested changes was made public the week of Sept. 4. Some of the suggested changes I agree with, some I hate, and, for what it’s worth, I offer my own suggestions on how to make the dataset better. If you’re a rail data nerd, you’ll like this analysis; if you’re a normal person … not so much.
Thank you for giving me the opportunity to study the STB-designated railroad operating metrics. The below recommendations are based on the varied experiences of the subgroup members and reflect my close review of the metrics.
I recommend removing the following metrics due to their redundancy in other metrics or not being beneficial for customers:
- • EP 724 Metric 5: Trains Held.
- • EP 724 Metric 7: Grain Cars Loaded and Billed by State.
- • EP 724 Metric 9: Coal Loadings, Plan Vs. Performance.
- • EP 724 Metric 10: Grain Loadings, Plan Vs. Performance.
- • EP 770 Metric 2: Train Starts.
- • EP 770 Metric 3: Car Status.
I have divided the metrics into two groups. One contains metrics that are important for customers and the other contains railroad fluidity metrics that are important for understanding overall railroad network health. They are listed below with recommendations.
Customer Metrics
EP 724 Metric 4: Dwell Time at Origin for Unit Trains
The regulatory text is sufficient. I suggest using a “Time at Customer” metric to see if there is a consistent correlation between “Release to Pull” and “Time at Customer.” There is some evidence of faster Release to Pull times as the Time at Customer decreases.
EP 724 Metric 6: Cars not Moved for 48-Plus Hours
The Subcommittee would like to expand this metric to include cars that have not moved for 24, 32, 48, 100, and 200+ hours.
EP 724 Metric 8: Outstanding Car Orders
I believe “past due” cars should be counted the day after an order was not filled with no grace period. This should eventually be rolled into a more comprehensive local service metric.
EP 770 Metric 6: Cancelled/Annulled Local Trains
Cancelled/Annulled local trains with reasons is a very important data point to railroads and shippers. I think any railroad that does not have this metric should develop it. It can give railroads insight into how to fix service issues as well as giving shippers an estimate of how long the local service issues will last. I am requesting the STB’s assistance to help convince the industry to develop this metric. I also believe this should eventually be rolled into a more comprehensive local service metric.
EP 770 Metric 5: Industry Spot and Pull
I believe there should be a more comprehensive industry standard for a local service metric that would include the percentage of ordered car placements and pulls compared to the total number of car events requested from customers on the scheduled days of service in an industry standard time window (recommendation is 12 hours from the scheduled serving job’s scheduled on duty time). The work completed time should be based on the finished pull/place events and safe customer access to the placed cars. A cancelled/annulled job should count as 0% in this equation as none of the requested work was completed unless another job completed the same work within the recommended time window.
It would also be helpful for the railroads to report the root cause data to track missed service (annulled, outside window, engine failure, blue flag, customer capacity, etc.). Any ordered car not pulled/placed or pulled/placed outside of the window will constitute a miss except customer related (blue flag, customer capacity, etc.). There should be a 5-day notice sent to affected customers when railroads change the scheduled on-duty time of scheduled jobs.
Open gate vs. closed gate rules:
- Closed Gate (Spots): Measure percentage of cars ordered by customer vs. cars actually placed.
- Closed Gate (Pulls): Measure percentage of cars billed to release by established cut off vs. cars pulled.
- Open Gate: Measure percentage of cars automatically ordered (does not include cars CPd) vs. cars actually placed.
- Open Gate: Same as Closed Gate.
EP 770 Metric 7: On-time Performance
This is the most important metric for customers, but also the most difficult to develop and standardize across the industry. I would like a standard metric for on-time performance that would span the entire trip for a car across multiple carriers. Performance will have to be measured against the operating plan for each shipment, and information would have to be shared between railroads. This is particularly difficult, since car trip plans can flex to different circumstances and evolve as the operating plan changes, making coordination between railroads more challenging.
I can start with each railroad independently developing an on-time performance metric if not already in place. There could be industry time standards around crew changes, set off, and pickup events.
- Carload: Percent of measured cars destined for a customer that arrive at or ahead of the original estimated time of arrival, notification, or interchange.
- Intermodal: Percent of measured containers destined for a customer that arrive at or ahead of the original estimated time of arrival, notification, or interchange.
Railroad Fluidity Metrics
- EP 724, Metric 1, Train Speed: I recommend changing velocity from line haul velocity between terminals to an origin – destination velocity. None of the current metrics include time lost at intermediate terminal locations which is the biggest source of train delay. A “beginning to end” velocity would capture that delay. Average train speed between origin and destination in miles per hour (does not include locals, yard jobs, work trains, or passenger trains).
- EP 724 Metric 2, Terminal Dwell, System and Top 10; and EP 770 Metric 1, Terminal Dwell, 11 through 20: I recommend no changes to the regulatory text or metric.
- EP 724 Metric 3, Cars on Line: I recommend no changes to the regulatory text or metric.
- EP 724 Metric 11, Carloads Originated and Received: This should be a more comprehensive interchange metric. The interchange score can be the percent of cars offered or interchanged compared to the total number of cars scheduled for interchange. I would like to remove the ability to count any cars that were auto-offered across all railroads. It should measure similarly to FMLM) first-mile/last mile) with scheduled windows and scheduled days of service. The interchange windows and scheduled days of service should be based on ISA (Interline Service Agreement) interchange agreements between railroads.
- EP 770 Metric 4, Unplanned Recrews: I recommend no changes to the regulatory text or metric.
I also recommend adding two railroad fluidity metrics:
- On-Time Originations: Percent of on-time departures for scheduled road trains at profiled origin +2 hours).
- On-Time Arrivals: Percent of on-time arrivals for scheduled road trains at profiled destination +2 hours).
Analysis of RSTAC Recommendations
Let’s start by looking at what the railroads are currently required to report to the STB, which subsequently becomes public. There are two sets of service metrics data:
1. EP 724: Following the industry meltdown on the back of the 2014 polar vortex, in October 2014 the STB implemented weekly reporting of service metrics, which has continued to this day. The docket number is EP 724 in the STB online filings. There are 11 data items required under EP 724:
- Average Train Speed by train type and overall system average train speed reported in MPH.
- Weekly average Terminal Dwell time excluding cars on run-through trains measured in hours for the 10 largest terminals in terms of railcars processed and the overall system.
- Weekly average Cars On Line by car type.
- Weekly average Dwell Time at Origin for unit train shipments measured in hours.
- Weekly average number of Trains Holding Per Day by train type and cause.
- Weekly average number of loaded and empty Cars in Revenue Service That Have Not Moved 48 Hours or greater.
- Weekly total Grain Cars Loaded and Billed by state.
- Grain Car Orders By State: (a) the running total number of orders placed; (b) the running total of orders filled; and (c) for orders that have not been filled, the number of orders that are 1-10 days past due and 11+ days past due.
- Weekly average Coal Unit Train Loadings or Carloadings versus Planned loadings by coal production region.
- Average Grain Shuttle Turns per Month By Region And System versus Planned turns per month (applicable to Class I carriers operating a grain shuttle program).
- Weekly Originated and Received Carloads by 22 commodity categories.
2. EP 770: Another disaster, another set of metrics. In addition to the continuation of EP 724 reporting, amid the 2022 Service Crisis, the STB rightly added additional, temporary reporting under docket number EP 770. There are eight additional items of data here:
- Average Terminal Dwell time (Excluding Cars on Run Through Trains) (Hours), Yards 11-20 in terms of railcars processed.
- Weekly average number of Train Starts Per Day by service type.
- Car Status, including weekly Total Car Miles, Car Miles Per Day, Cars per day in Service with Mileage, Cars per day in Service with No Mileage, and Cars per day in Storage. All numbers are further broken down by Private cars, for the total Railroad, and TTX (intermodal) cars.
- Weekly unplanned Recrews and Recrew Rate.
- Industry Spot and Pull.
- Weekly total Local Trains Cancelled and Local Trains Cancelled per day.
- On-time Performance to within 24 hours for Manifest, Grain, Coal, Automotive, Crude, Ethanol, and Intermodal service.
- Monthly Reporting of Employment Data. (note: monthly; everything else is weekly.)
EP 770 reporting is currently due to expire on Dec. 31, 2023, but it has already been extended by the STB twice and may be again. Our guess is that instead of constant extensions, consolidating EP 724 and 770 into one permanent and improved data set might be the goal here, hence the RSTAC tasking. For the purposes of this analysis, let’s assume it is. Also note that on Sept. 7, the STB issued a Notice of Proposed Rulemaking on Reciprocal Switching that includes making items 5 and 7 above permanent in terms of ongoing reporting.
RSTAC Adds and Subtractions
RSTAC is proposing two new metrics, which I agree are good ideas:
- On-time Originations: percent of on-time departures for scheduled road trains at profiled origin +2 hours.
- On-time Arrivals: percent of on-time arrivals for scheduled road trains at profiled destination +2 hours.
In terms of RSTAC recommended eliminations, here’s where I have a problem:
- EP 724 Metric 5: Trains Held.
- EP 724 Metric 7: Grain Cars Loaded and Billed by State.
- EP 724 Metric 9: Coal Loadings, Plan vs. Performance.
- EP 724 Metric 10: Grain loadings, Plan vs. Performance.
- EP 770 Metric 2: Train Starts.
- EP 770 Metric 3: Car Status.
Three of the six proposed deletions—points 2, 3, and 4—I don’t have a problem with, but that leaves three that I would regard as a big mistake to eliminate.
Don’t Eliminate: Trains Held for Crews, Power, and Other
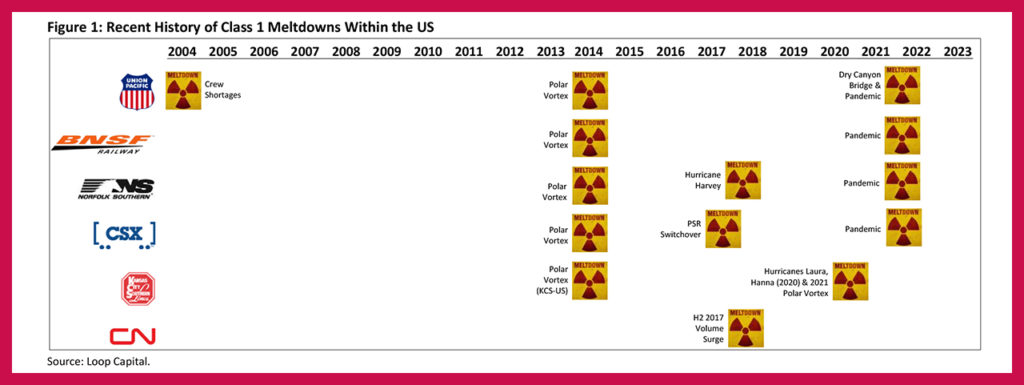
Oh boy, where to begin with this one? Let’s put it this way: Here’s a graphic that shows every Class I meltdown in the U.S. since 2004. Starting in that year, Union Pacific melted down due to a shortage of crews; all the U.S. railroads were slowed by the 2014 polar vortex to the point where they ran out of crews; CN’s late 2017 volume surge depleted crews; domino effects from Hurricane Harvey triggered a crew crunch at Norfolk Southern in 2018; and all of the “Big Four” U.S. systems ran out of crews, again, last year. Crew capacity deficits at key locations were the killer blows that put the railroads into a meltdown state in 12 of the past 14 episodes, with the only exceptions being when Hunter Harrison rushed the CSX PSR implementation and Kansas City Southern was pounded by two hurricanes and a vortex.
So, logically, any regulatory effort to monitor the core problem needs to, first and foremost, tackle crew availability. The more ways you can try to get at this issue and derive insight into crew capacity relative to crew demand the better, and there’s good news and bad news in this regard.
The bad is that I have only one, solitary, metric that tackles crews: Trains Held for Crews. The good news is that it’s an excellent measure; in fact, in my view, it’s the second-best measure of network health after network velocity. The beauty of measuring trains holding for crews is that it provides insight into crew supply vs. demand. When demand is too high relative to supply, trains holding for crews is rising, and vice versa. It’s basically the industry’s early warning system.
Now imagine our reaction when I opened the RSTAC document and at the top of the list of things to eliminate is Trains Held. In an industry that has had a chronic crew management problem for the past decade, your first order of business is to eliminate the one good metric we have on crew management?! This is why your paper gets an ‘F’.
Here’s an idea: Instead of eliminating it, why not: 1) improve it; and 2) supplement it by coming up with other insightful crew management measures? Yes, there are recrews, but they’re more a derivative of slow or erratic velocity rather than crew capacity shortfalls.
Improving the Trains Holding Metric
Under EP 724, the railroads had wide latitude to define and capture these metrics as they saw fit. For Canadian Pacific Kansas City’s operation within the U.S., it uses an all-in methodology. All departures that are six hours or more late are tagged as Held and a reason given (crews, power or other). In contrast, all the other railroads use a snapshot methodology, with varying parameters. In a snapshot, you pick one time of the day (it’s 3:30 AM for CSX, 6 AM for NS, and midnight for CN, for example) and count the number of trains that are being held at that time, but again with varying parameters. CSX counts trains if they’ve been held for one hour or more, it’s four hours for NS and UP, and zero hours at BNSF and CN. So when you look at 14 trains per day held for crews at CSX in my weekly report, for example, that’s actually a subset of all trains held for crews. CSX is only counting the trains for which departure has been delayed for an hour or more as at 3:30 AM.
While the Trains Held data as it currently stands is highly relevant and useful, there’s clearly scope here for some standardization. Basically, make all the railroads report it the same way: either all-in with a mandated delay in hours, or snapshots that take place at the same time of day for each network. Trains are deemed held if the departure delay exceeds a delay in hours that’s also the same for all systems.
For what it’s worth, all-in with a two-hour delay would be my choice. The benefit of this is that you could then divide trains per day holding for crews by average daily train starts to derive the percentage of train delays caused by crews (and the same methodology for power). Apart from being a simpler, standardized and insightful metric, it would also be comparable across railroads, which the current metric is not.
Supplementing the Trains Holding Metric
Here’s an example of providing more visibility into the crew capacity problem. One of RSTAC’s proposed metrics, on-time originations to within two hours for scheduled road trains, is good but it’s incomplete. Root failure cause need to be added. The metric should be four numbers, not one:
- Percent on-time.
- Percent late due to crews.
- Percent late due to power.
- Percent late due to other.
For example, Railroad A 80% on-time with 8% of the failures due to crews, 5% due to power, and 7% for all other reasons. With this simple tweak, you’ve now doubled your metrics that look at crew availability. Additionally, the proposed RSTAC metric is for scheduled road trains, whereas the trains holding for crews includes all trains, so you’re also coming at the crew problem from different angles, which is what you want.
Don’t Eliminate: Train Starts
I’m also opposed to the elimination of average daily train starts, for three reasons:
- One of the STB’s mandates it to promote adequate and reliable service, and you can equate “service” to train starts. When you add train starts, you’re literally adding service, and when you’re reducing train starts you’re taking service away. This is a metric I wish we’d had during the big PSR implementations, because it would have detailed exactly how aggressive each railroad was as they moved to a fewer starts/longer train model. Keeping it will alert us to any attempt at PSR 2.0. A railroad visibly adding train starts is also a positive signal of confidence and growth.
- It’s a great baseline in terms of activity levels. Dividing almost any railroad metric by average daily train starts provides insight, and allows customers, railroads and Wall Street to develop their own metrics. For example, I use train starts when pro-rating on-time performance metrics to derive a U.S. countrywide number. If Railroad A’s ag business represents 3.7% of U.S. daily train starts, I weight its on-time performance by 3.7% in my roll-up. Another example is above in my Trains Held discussion, where using train starts as the denominator under an all-in trains holding metric would quantify the percentage of trains held. Another potential use is to divide current, active crews from the monthly employment data by average daily starts to see, for each railroad and the industry, at what level of crews per daily train starts does crew capacity historically start flashing yellow and then red in terms of a crew crunch. It’s an additional insight into crew capacity and on my to-do list. Dividing volumes by train starts will tell you the story on train length. I could go on, but you get the picture.
- It provides context for on-time performance metrics. For example, the week of Sept. 4, UP’s manifest on-time performance was 72%. How important is that result in the context of how the full system is delivering service to customers? To answer the question, you need to know that manifest service represented 56% of total train starts last week, so manifest on-time performance—representing more than half of all “service”—is extremely important for UP. It’s less important for BNSF, where manifest service accounted for 44% of train starts.
Separately, CSX adjusts average daily trains starts for length of haul, and as a result reports more train starts than UP and BNSF. I have no idea why, no other railroad does this, and we’d like to see CSX stop these adjustments.
Don’t Eliminate: Car Status – Car-Miles Per Day
There’s a raft of car status data points under EP 770 Item 3 that are probably superfluous. However, when you drill down, there’s one nugget in there that’s worth keeping: Car-miles per day, broken down into Private, Railroad and TTX.
Private car-miles per day is the key one and here’s why: At the highest level, customers care about price, on-time performance or some level of service consistency, and asset turns on their equipment.
Private car-miles per day directly targets asset turns. Most of the railcars on the system are owned or leased, and additionally maintained, by customers. Some spend millions of dollars on their car fleets, and they care a great deal how fast these assets are turning. If they’re turning too slowly, the customer needs to acquire more and inject them into the system. If the railroads are turning these assets faster, it enables the customers to pull some out to reduce their capital commitments.
This was part of the PSR grand bargain the railroads made with customers: We’ll simplify the networks, which will result in turning your assets faster, so you’ll need fewer of them. Some reading this will also know that UP uses car-miles per day as one of its primary performance measures, and this is the subset of that number that customers care most about. High private car miles per day = happy customers.
Other Issues With RSTAC Recommendations
Train Speed: As it currently stands, train speed or “velocity” is measured in linehaul mph between yards and terminals. RSTAC is recommending changing this to an origin-destination basis. For example, Train A travels 50 mph for 10 hours, the cars are processed through an intermediate yard for 10 hours, and then the train travels another 10 hours at 50 mph. Under the current metric, train speed would be 50 mph as intermediate terminal dwell is ignored. Under the origin-destination methodology, velocity would be adjusted down to 33.3 mph, with 10 of the 30 hours at 0 mph in the yard.
The origin-destination measure is essentially a blend of the traditional velocity measure and terminal dwell. It’s trying to do both with one number. It’s a good, useful number, and would be critical if we didn’t already have separate terminal dwell numbers, which of course we do. My view here is “ain’t broke, don’t fix.”
Another drawback of shifting to an origin-destination velocity metric is that you’d lose your baseline. For each railroad, I have 20 years of velocity data that shows where it tops and bottoms during recessions, recoveries, hurricanes and polar vortexes. I know, for example, that as a rule of thumb UP’s customers are happy when velocity is above 25 mph, and when it’s below that—not so much. We’d lose all that historical context.
If the STB does decide to shift this metric to an origin-destination basis, I would ask that the old metric be continued for at least three years alongside the new metric. That way, with a three-year overlap, a simple regression would allow people to adjust the historic metric to ballpark the new.
Unplanned Recrews: I like the recrews metrics and they’ve been worthy additions. RSTAC is recommending no changes, but we’d like to see the definition of recrew rate standardized across the industry. I don’t know if this is the best or worst definition, but RSTAC should come up with its own definition and have it reported by all. Recrews/(Road + Local + Yard + Recrews + Deadheads + Other Starts).
Putting the Pieces Together
Let’s remove the metrics that I agree with RSTAC are unnecessary, add the two new metrics it’s recommending, consolidate dwell for yards (EP 724) with yards (EP 770), and add our own (italicized) tweaks and caveats as we’ve discussed. Here’s how a consolidated STB reporting requirement might look:
- Average Train Speed by train type and for the overall system, in MPH. The traditional metric, not dwell-adjusted.
- Car Miles Per Day broken out by Private, Railroad, and TTX.
- Terminal Dwell in hours excluding cars on run-through trains for the 20 largest yards/terminals and the for the overall System.
- 48-Hour Delays. Weekly average loaded and empty cars in revenue service immobile for 48+ hours.
- Dwell Time at Origin for unit train shipments measured in hours.
- Cars-on-line by car type, with CSX ceasing to adjust for length of haul and restating numbers reported to-date.
- Trains Holding Per Day by train type and cause (crews, power, other). Standardize to an all-in methodology with a two-hour cut-off. Ideally, continue reporting the old metric in parallel for three years to generate an overlap (a regression can then convert old to new).
- Recrews and Recrew Rate. Total weekly recrews. Study and standardize the definition of recrew rate.
- Industry Spot and Pull.
- Trains Cancelled and Trains Cancelled per Day.
- On-time Performance to within 24 hours for Manifest, Grain, Coal, Automotive, Crude, Ethanol, and Intermodal service. For intermodal service, CSX and NS mark a train on-time when it arrives at the destination terminal, while UP and BNSF base it on the percentage of containers deramped within 24 hours of plan. If 79% of the boxes are unloaded and available for customer pickup, on-time performance is 79%. Standardize to the superior western definition. NS and CSX reporting ~98% every week on their easier definition and shorter hauls isn’t helpful.
- On-time Originations. The percentage of on-time departures for scheduled road trains at profiled origin +2 hours, with root cause of failures quantified into crews, power, and other.
- On-time Arrivals. The percentage of on-time arrivals for scheduled road trains at profiled destination +2 hours.
- Grain Car Orders by State.
- Originated and Received Carloads, weekly, by 22 commodity categories.
- Monthly reporting of employment data.
For items 4, 5, 10, 11, 12, 15, and 16 above, RSTAC, in its document, recommends its own improvements and areas for further study; all of with which I’m on board. Also remember that while this list is attractive in terms of ongoing reporting, the reality is that most of the EP 770 items might simply go away at some point—possibly at year end.
Final Thoughts
We’re starting from a strong position because the STB has already done a good job over the years teasing out metrics from these companies that tell the story regarding how they’re operating. I think the list above, with my tweaks, would further improve current reporting. Going forward, I believe the three areas of focus should be:
- Developing at least one more good crew capacity metric.
- Improving the quality of on-time performance metrics, as RSTAC has also highlighted.
- Start thinking about data integrity, as the railroads, rightly or wrongly, have a reputation for massaging some of these numbers to make their operations look better than they actually are.


![“This record growth [in fiscal year 2024’s third quarter] is a direct result of our innovative logistic solutions during supply chain disruptions as shippers focus on diversifying their trade lanes,” Port NOLA President and CEO and New Orleans Public Belt (NOPB) CEO Brandy D. Christian said during a May 2 announcement (Port NOLA Photograph)](https://www.railwayage.com/wp-content/uploads/2024/05/portnola-315x168.png)