RSI: Railcar backlog increases 10%
Written by William C. Vantuono, Editor-in-ChiefThe Railway Supply Institute ARCI (American Railway Car Institute) Committee on July 25 published its railcar industry order, delivery and backlog statistics for second-quarter 2017. Orders in the quarter improved sequentially to 17,665 cars from 4,814 cars in the first quarter. Deliveries of 10,625 railcars increased 5.8% from 10,042 railcars. The backlog now stands at 66,561 railcars, up 10.1% from the prior quarter’s level of 60,471 cars, and the first sequential increase in the backlog since fourth-quarter 2014—11 quarters.
The industry book-to-bill came in at 1.7x, “significantly higher than last quarter’s figure of 0.5x,” notes KeyBanc Capital Markets Inc. Managing Director Steve Barger. “In the quarter, respective book-to-bill for tank and non-tank activity was 2.0x and 1.6x, vs. 0.7x and 0.4x, respectively, in 1Q17.”
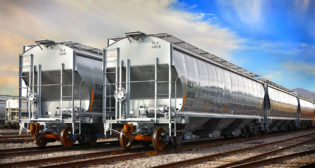
Order activity “largely outperforms 1Q17 trends,” Barger says. Non-tank car orders totaled 13,207 railcars in 2Q17, vs. 3,225 in 1Q17. Covered hoppers, which showed the largest concentration in orders, totaled 9,233, or 52% of the total orders, slightly below 1Q17’s 53%. Medium-cube covered hoppers represented the majority, at 5,515 cars, vs. 1,237 cars ordered in 1Q17. Orders for large-cube and small-cube covered hoppers were 994 and 2,724 cars, respectively, vs. 841 and 497, respectively, in 1Q17. Industry orders for tank cars totaled 4,458 vs. 1Q17 orders for 1,589 tanks. Together, tank and covered hoppers accounted for more than 77% of total orders in 2Q17 vs. 86% in 1Q17.
2Q17 deliveries of 10,625 consisted of 2,209 tank cars and 8,416 non-tank cars. 2Q17 tank deliveries increased about 6% sequentially. “We think current deliveries imply the industry has approximately 6.3 quarters of tank backlog visibility,” Barger said.
The industry backlog of 66,561 railcars “implies just over 6.0 quarters (18 months) of theoretical production visibility,” Barger says. “The tank backlog increased about 12% sequentially to 18,958. The non-tank backlog increased about 10% to 47,603, vs. the prior quarter’s 43,472. We think the industry backlog continues to trend toward a more ‘normalized’ concentration of car types consisting of 28% tank, 29% small-cube covered hopper, 19% medium-cube covered hopper, and 10% large-cube covered hopper. Additionally, the industry data implies a net cancellation of 950 railcars, which we think were within box car, gondola, and tank car types.”
Download Barger’s full report at the link below.


