Freight car orders stay strong in 4Q15
Written by William C. Vantuono, Editor-in-ChiefThe Railway Supply Institute on Jan. 28, 2016 published its railcar industry order, delivery and backlog statistics for fourth-quarter 2015, and overall, the sector looks solid, according to Steve Barger, Managing Director and Equity Research Analyst with KeyBanc Capital Markets Inc.
Orders in the quarter increased to 9,169 cars from 7,374 cars in third-quarter 2015. Deliveries of 20,296 cars (8,341 tank cars and 11,995 non-tank cars) compared favorably with the previous quarter’s “strong” delivery figure of 20,476. The backlog now stands at 111,019 cars, down 9.4% from the prior quarter’s 122,591, “though still at historical highs,” notes Barger.
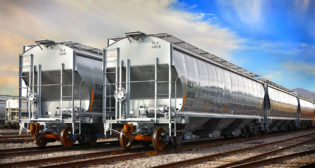
Tank car orders totaled 1,176 vs. third-quarter 2015 orders of 1,463. “While the order number is modest, we think it could be better than concerns warranted, and likely represents demand trends for non-energy tank cars,” says Barger. Non-tank-car orders totaled 7,993 in the quarter, vs. 5,911 non-tank cars in third-quarter 2015. Covered hoppers, which showed the largest order concentration, totaled 5,453, about 60% of the total and well above third-quarter 2015’s 51%, with small-cube covered hoppers representing the majority at 2,850 cars, vs. zero small-cube cars ordered in third-quarter 2015. Orders for mid-cube and large-cube covered hoppers were 1,138 and 1,465 cars in the quarter, respectively, vs. 672 and 3,113, respectively, in third-quarter 2015. Together, tanks and covered hoppers accounted for more than 72% of total orders in the quarter, about even with 71% in third-quarter 2015.
“Industry book-to-bill came in at 0.5x, slightly better than 3Q15’s figure of 0.4x,” notes Barger. “In the quarter, respective book-to-bill for tank and non-tank activity was 0.1x and 0.7x, respectively. We think the weak book-to-bill for tanks is primarily attributable to customers delaying orders as they continue to assess their fleet for DOT compliance in the midst of volatile oil prices.”
Tank car deliveries were down 6% sequentially, “implying an annual capacity of 33,000-35,000 cars,” says Barger. “If that range is correct, it implies the industry enjoys approximately 3.5 quarters of tank backlog visibility.”
“On current deliveries, we think the backlog of 111,019 units implies approximately 5.5 quarters of theoretical production visibility,” notes Barger. “The tank car backlog decreased approximately 20% sequentially to 30,789 cars, or 28% of the total backlog, vs. 31% in third-quarter 2015. The non-tank backlog moderated to 80,230 railcars, down from the prior quarter’s 84,137.”