
Rail Traffic Registers Small Weekly, Monthly Gains
Written by Marybeth Luczak, Executive Editor
In reporting U.S. rail traffic for the week ending Sept. 3, 2022, as well as volumes for August 2022, Association of American Railroads Senior Vice President John T. Gray said, “Things can change quickly, but there are reasons to believe the economy is on track to stimulate continued improvements in rail volumes.”
“To be sure, some traffic categories are doing better than others, just like some sectors of the economy are doing better than others,” Gray observed on Sept. 7. “Through additional hiring and continued investments, railroads are preparing themselves for growth.”
August 2022
According to AAR, U.S. Class I railroads hauled 1,189,892 carloads in August 2022, up 2.3%, or 27,040 carloads, from the same month last year; and 1,335,618 containers and trailers, down 1.2%, or 15,856 units, from August 2021. Combined U.S. carload and intermodal originations last month were 2,525,510, up 0.4%, or 11,184 carloads and intermodal units from August 2021.
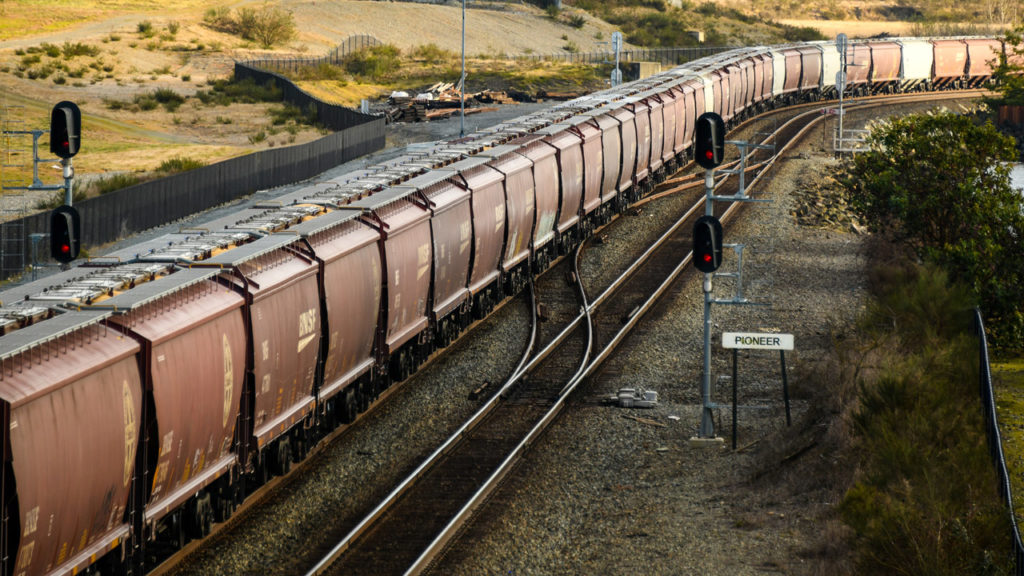
In August 2022, 11 of the 20 carload commodity categories tracked by the AAR each month saw carload gains compared with August 2021. These included coal, up 17,468 carloads or 5.2%; grain, up 12,594 carloads or 14.1%; and crushed stone, sand and gravel, up 7,327 carloads or 7.1%. Commodities that saw declines included primary metal products, down 6,711 carloads or 14.1%; all other carloads, down 4,914 carloads or 15.9%; and petroleum and petroleum products, down 3,410 carloads or 6.6%.
Excluding coal, carloads rose by 9,572 carloads, or 1.2%, in August 2022 from August 2021. Excluding coal and grain, carloads dipped by 3,022 carloads, or 0.4%.
In comparison, total U.S. rail traffic dropped during the previous three months of 2022:
- In July 2022, combined U.S. carload and intermodal originations came in at 1,940,809, down 1.5%, or 29,881 carloads and intermodal units from July 2021. U.S. Class I railroads hauled 906,903 carloads in July 2022, up 0.2%, or 2,213 carloads, from July 2021; and 1,033,906 containers and trailers, down 3%, or 32,094 units.
“Rail traffic in July was evenly balanced between commodities with carload gains and those with carload declines,” John Gray said on Aug. 3, 2022. “As such, it does not provide definitive evidence regarding the state of the overall economy. In that respect, it is very similar to most other recent economic indicators.” - In June 2022, combined U.S. carload and intermodal originations were 2,480,674, down 3.2%, or 81,453 carloads and intermodal units from June 2021. U.S. Class I’s carried 1,157,555 carloads, down 1.5%, or 17,970 carloads, from June 2021; and 1,323,119 containers and trailers, down 4.6%, or 63,483 units.
“As conjecture grows about the direction of the U.S. economy, June rail traffic doesn’t offer definitive answers on whether a recession is looming or not,” John Gray noted on July 6, 2022. “Like many other economic indicators today, rail traffic is a mix of red, yellow and green, with some traffic lines, such as automotive, providing generally positive indicators, while others, such as chemicals, being a bit more subdued than they were earlier in the year.” - In May 2022, combined U.S. carload and intermodal originations were 2,031,300, down 4%, or 85,079 carloads and intermodal units from 2021. U.S. railroads originated 928,742 carloads, falling 3.7%, or 35,821 carloads, from May 2021. They also originated 1,102,558 containers and trailers, decreasing 4.3%, or 49,258 units, from May 2021.
“Rail traffic volumes in May reflected an economy that is a mixture of good and not-so-good,” John Gray reported on June 1, 2022. “Auto production and auto carloads seem to be slowly recovering; crushed stone and sand, and food-related volumes are showing strength while intermodal had its best month since June 2021. On the other hand, carloads of chemicals fell for the first time in more than a year in May, while grain volumes continued to be disappointing when compared to those of 2021 and the latter half of 2020.”

How do the August 2022 rail traffic results compare with those of August 2021, 2020 and 2019? Let’s review:
- While U.S. carloads were up 4.1% in August 2021, the 3.3% fall-off in intermodal volume kept combined traffic virtually flat with the prior-year period, as railroads navigated “chassis and container shortages at ports; shortages of drayage truck drivers; port congestion; insufficient warehouse capacity at many locations; and now, weather problems in the Gulf,” AAR’s John Gray reported on Sept. 1, 2021. Faced with these challenges—like others in the supply chain—railroads are hard at work with stakeholders “to keep the national rail network fluid,” he said.
U.S. Class I railroads moved 934,762 carloads in August 2021, rising 4.1% (or 36,815 carloads) from last year; and 1,085,345 containers and trailers, dropping 3.3% (or 37,603 units). Total U.S. carload and intermodal originations for the month were 2,020,107, a loss of 788 carloads and intermodal units from August 2020. - John Gray observed on Sept. 2, 2020: “Despite the pandemic and the associated economic dislocations, an enormous amount of freight continues to move on railroads and other transportation modes. For U.S. railroads, August 2020 was the best month in terms of intermodal loadings since October 2018 and the fifth best intermodal month ever. Much of what’s inside the trailers and containers on an intermodal train ends up on the shelves of stores, or finds its way to consumers’ doors via e-commerce merchants. Railroads help ensure that consumers get what they want, when they want it.”
U.S. railroads originated 898,227 carloads in August 2020, down 14.9%, or 156,797 carloads, from August 2019. U.S. railroads also originated 1,122,954 containers and trailers in August 2020, up 3%, or 33,115 units, from the same month in 2019. Combined U.S. carload and intermodal originations in August 2020 were 2,021,181, down 5.8%, or 123,682 carloads and intermodal units from August 2019. - John Gray reported on Sept. 4, 2019: “While the strength of the overall economy remains unclear, in the last quarter it has become much more evident that the portion of the economy which generates freight—manufacturing and goods trading—has weakened significantly. Total U.S. freight carloads have fallen on a year-over-year basis for seven straight months, and that’s true even after excluding coal and grain, the major rail commodities least sensitive to overall economic health. Year-over-year intermodal volumes, typically a reliable indicator of consumer spending and intermediate manufacturing demand, have fallen for seven straight months. We had a similar pattern in 2016, when rail traffic was weak and the overall economy wobbled but didn’t fall down. Railroads are hopeful that the uncertainty plaguing economies here and abroad will dissipate soon and solid economic and industrial growth will return.”
U.S. railroads originated 1,055,386 carloads in August 2019, down 4.6%, or 50,672 carloads, from August 2018. U.S. railroads also originated 1,089,849 containers and trailers in August 2019, down 5.4%, or 61,839 units, from the same month last year. Combined U.S. carload and intermodal originations in August 2019 were 2,145,235, down 5%, or 112,511 carloads and intermodal units from August 2018.
Year to Date 2022
Total U.S. carload traffic for the first eight months of 2022 was 8,090,712 carloads, increasing 0.3%, or 20,430 carloads, from the prior-year period; and 9,248,250 intermodal units, decreasing 5.1%, or 501,232 containers and trailers, from last year.
Total combined U.S. traffic for the first 35 weeks of 2022 was 17,338,962 carloads and intermodal units, a 2.7% drop from the year-ago period.
Week 35 (Ending Sept. 3, 2022)
Total U.S. weekly rail traffic was 513,087 carloads and intermodal units for the week ending Sept. 3, 2022, rising 3.7% from the same point last year. Total carloads for the week came in at 241,431, up 5.7% compared with the same week in 2021, while U.S. weekly intermodal volume was 271,656 containers and trailers, up 2.1% from 2021.
This is the fourth time in six weeks that a gain in total rail traffic has been reported; it is the first week that both carloads and intermodal volume have risen. Prior to the week ending July 30, 2022, there had been 22 consecutive weeks of total traffic declines.
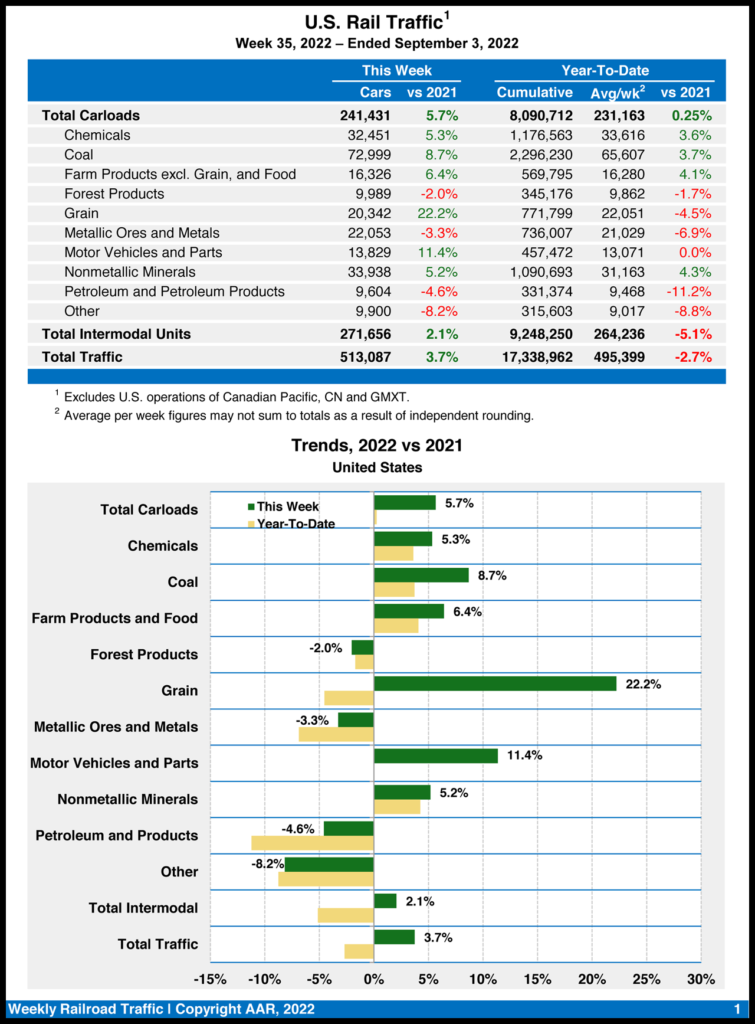
Six of the 10 carload commodity groups posted an increase for the week ending Sept. 3, 2022 compared with the same week in 2021. They included coal, up 5,833 carloads, to 72,999; grain, up 3,699 carloads, to 20,342; and nonmetallic minerals, up 1,668 carloads, to 33,938. Commodity groups that posted declines included miscellaneous carloads, down 881 carloads, to 9,900; metallic ores and metals, down 748 carloads, to 22,053; and petroleum and petroleum products, down 462 carloads, to 9,604.
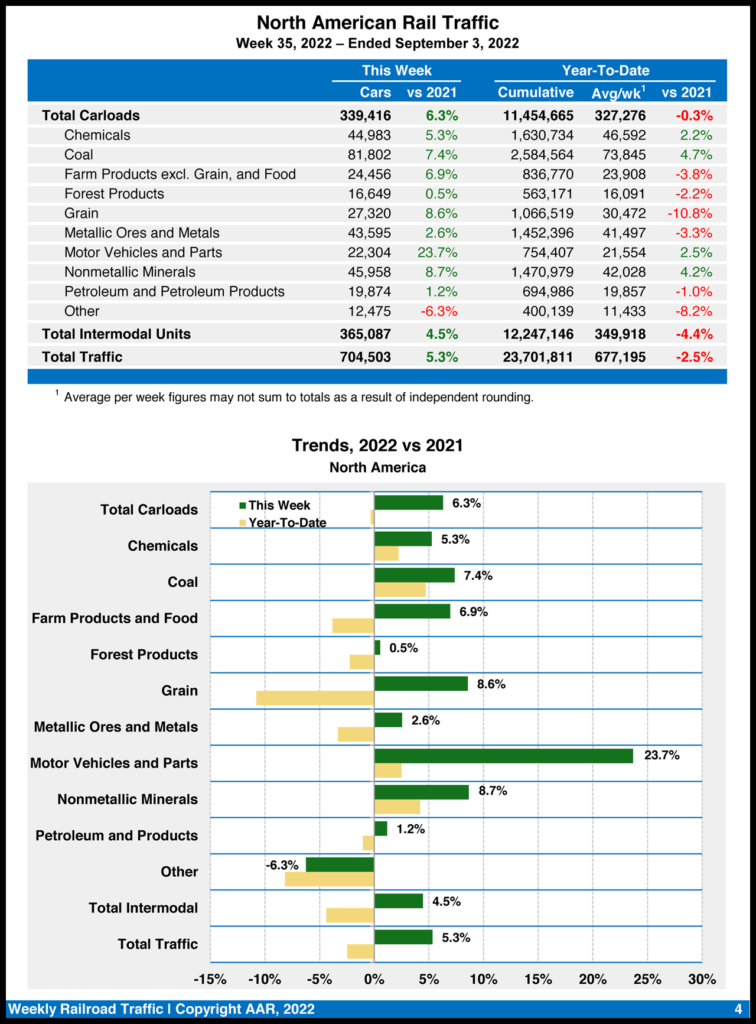
North American rail volume for the week ending Sept. 3, 2022, on 12 reporting U.S., Canadian and Mexican railroads totaled 339,416 carloads, increasing 6.3% from the same week last year, and 365,087 intermodal units, gaining 4.5% from last year. Total combined weekly rail traffic in North America came in at 704,503 carloads and intermodal units, up 5.3%. North American rail volume for the first 35 weeks of 2022 was 23,701,811 carloads and intermodal units, down 2.5% compared with 2021.

Canadian railroads reported 75,842 carloads for the week, rising 2.4%, and 77,146 intermodal units, increasing 8.5% from the prior-year period. For the first 35 weeks of 2022, they reported cumulative rail traffic volume of 5,050,927 carloads, containers and trailers, a 2.8% fall-off.
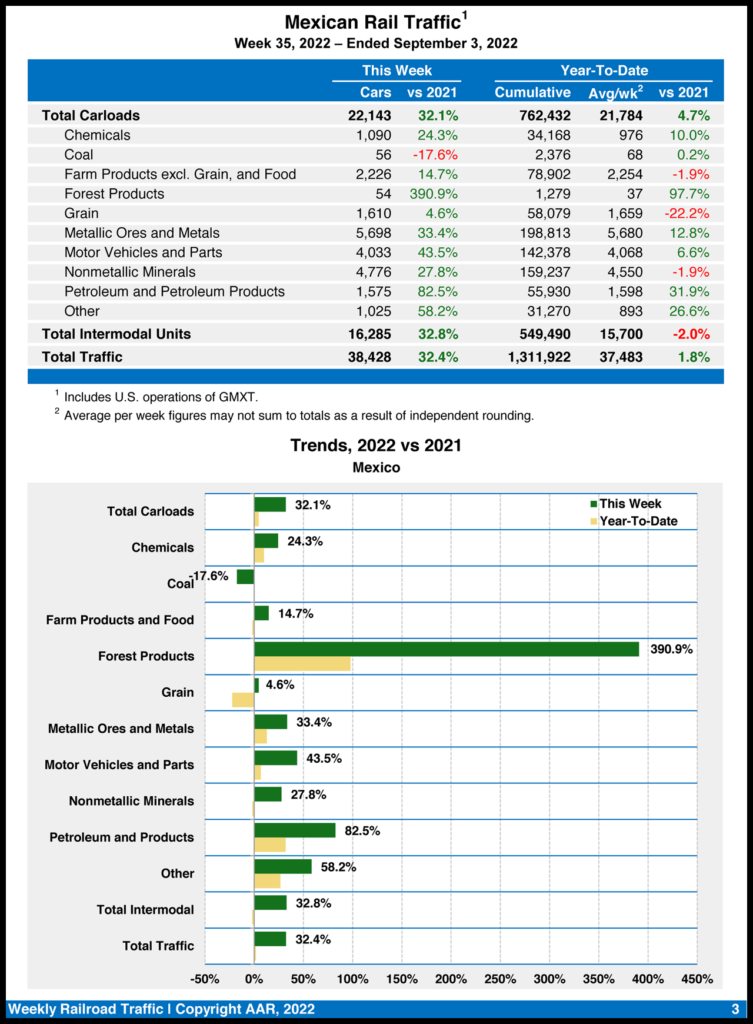
Mexican railroads reported 22,143 carloads for the week, a 32.1% boost over the same week last year, and 16,285 intermodal units, a 32.8% gain. Their cumulative volume for the first 35 weeks of 2022 reached 1,311,922 carloads and intermodal containers and trailers, increasing 1.8% from the same point in 2021.


![“This record growth [in fiscal year 2024’s third quarter] is a direct result of our innovative logistic solutions during supply chain disruptions as shippers focus on diversifying their trade lanes,” Port NOLA President and CEO and New Orleans Public Belt (NOPB) CEO Brandy D. Christian said during a May 2 announcement (Port NOLA Photograph)](https://www.railwayage.com/wp-content/uploads/2024/05/portnola-315x168.png)