
Predicting Wheel Wear
Written by Matthew Witte, Ph.D., Scientist, MxV Rail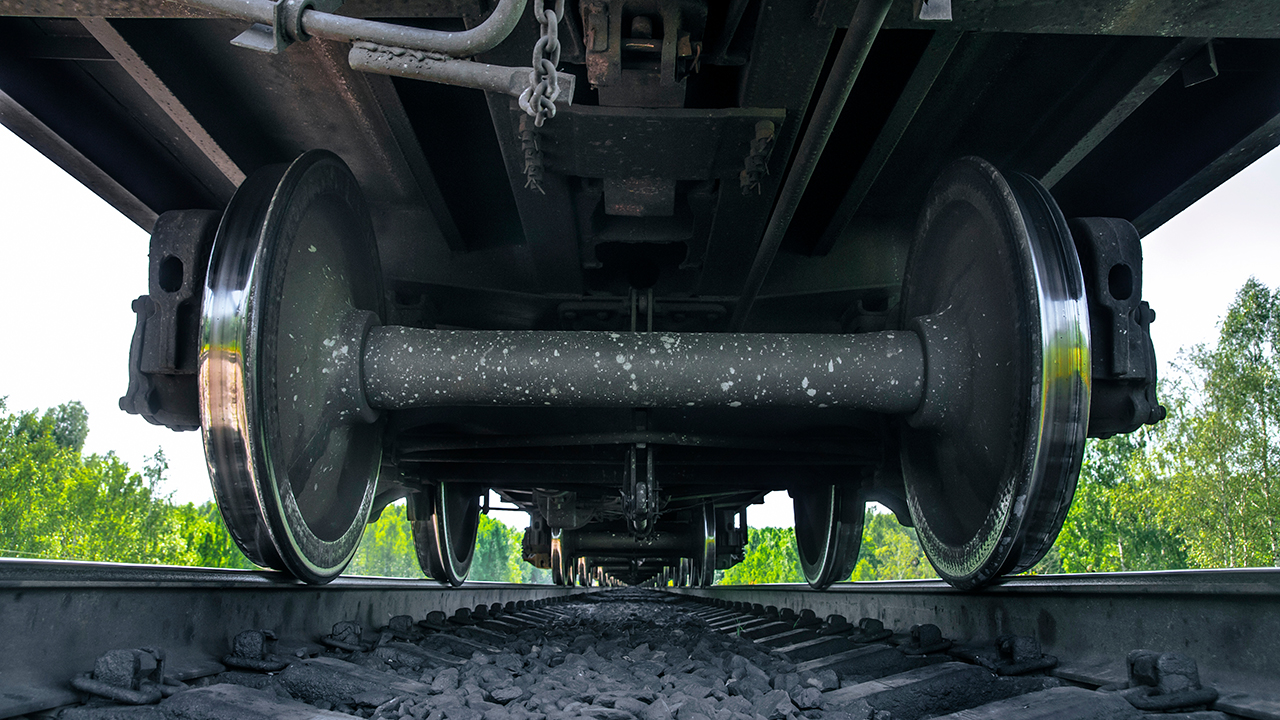
Shutterstock/VMCgroup
MxV RAIL R&D, RAILWAY AGE JANUARY 2024 ISSUE: MxV Rail analyzed wheel profile detector (WPD) data to determine the potential for predicting wheel end-of-useful life based on wear rates. Preliminary results indicate that it may be possible to accurately predict when a wheel will reach the end of its useful wear life. Such predictions would allow car owners and operators to determine the optimal time for scheduling wheel change outs to maximize asset utilization and minimize service disruptions.
Utilizing the extensive collection of historical data provided by Railinc, MxV Rail created a subset of WPD data from North American detectors by selecting the top 10,000 freight railcars that passed any single WPD most frequently. As a result of this selection method, researchers found that two railcar types, Type J (Gondola Car, 5,370) and Type K (Equipped Hopper Cars, 2,951), made up the majority within the subset. Wheels that ultimately were removed for one of the following Why Made (WM) codes: WM60 Thin Flange, WM63 Wheel Tread Hollow, WM64 High Flange, or WM73 Thin Rim were identified within this population. The identified wheels were analyzed both individually and in groups based on the WM code. Trends were studied per failure criterion by car type and axle position, and wear rate studies were performed based on estimated mileage provided by Railinc.
Because the actual in-service date is unknown for the wheels in this population, the wear life was estimated per wear factor by calculating the nominal wear rate slope for that factor and then extrapolating over the range of dimensions from new to AAR condemnable limits. For certain factors, such as wheel hollow and flange thickness, the wear trend shows an inflection where the wear rate slope signifcantly increases. For these cases, the slope after the inflection was used. For flange thickness, the inflection point occurs when wheel hollowing reaches approximately 1.5 mm.
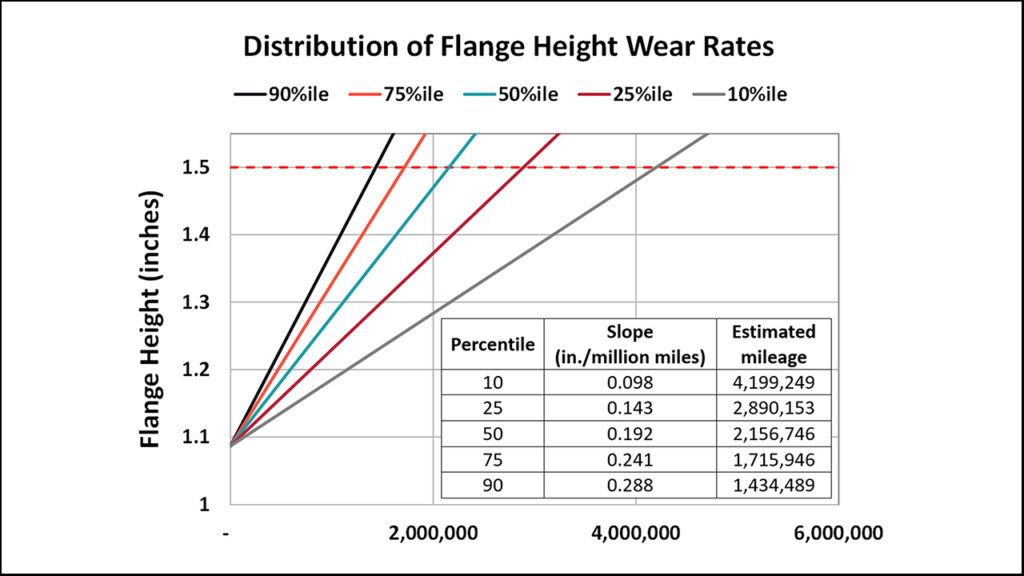
Figure 1. Range of average flange height wear rates expressed as percentiles.
Figure 1 (above) shows the flange height wear rates with the data broken down into select percentile values with each value plotted linearly from new to the AAR condemnable criteria. This figure offers a theoretical representation to help visualize the number of miles it would take a new wheel to wear to the AAR condemnable limits based on the range of median wear rates identified and given the calculated slopes. The range of wear rates is quite large over this population of cars. Half of the data points fall in the range between ~2 million miles (orange line) and ~3.5 million miles (red line).
This calculation was performed for both car types and at each axle position, and similar results were observed for the other wear parameters. The median wear rate range of variation between the longest- and shortest-lived wheels in the sample set for each of the wear factors is approximately a factor of four. When studied on wheelsets with known cause for removal, wear rate trends per wear parameter showed uniformity. Ultimately, this shows promise for providing researchers with the ability to predict the end-of-life point by extrapolation.
A population with a uniform wear rate may result in predictable optimized wheel removal. However, further studies are needed to determine whether the wear trends per parameter per wheel in the general population will follow a similar pattern and whether the wear can be extrapolated across all parameters with sufficient precision to predict wheel end-of-life with enough accuracy to be useful. Any future studies should develop methods to account for measurement and wear rate variations.
The initial study performed by MxV Rail did not attempt to explain wear rate differences or why the wear rate differences develop. Future work will expand beyond the WPD dataset to focus on finding the characteristics of the equipment population that display the most uniform wear rates for each wear parameter. This work will require expanding the datasets to include design characteristics (e.g., suspension type), wear characteristics (e.g., wedge rise), and service characteristics (e.g., loaded duty cycles).


![“This record growth [in fiscal year 2024’s third quarter] is a direct result of our innovative logistic solutions during supply chain disruptions as shippers focus on diversifying their trade lanes,” Port NOLA President and CEO and New Orleans Public Belt (NOPB) CEO Brandy D. Christian said during a May 2 announcement (Port NOLA Photograph)](https://www.railwayage.com/wp-content/uploads/2024/05/portnola-315x168.png)