
Derailment Prevention: Following the ‘Five I’ Model
Written by Gary T. Fry, Vice President, Fry Technical Services, Inc.; Railway Age Contributing Editor
Photo: William Beecher
RAILWAY AGE, AUGUST 2023 ISSUE: Welcome to “Timeout for Tech with Gary T. Fry, Ph.D., P.E.” Each month, we examine a technology topic about which professionals in the railway industry have asked to learn more. This month we focus on high level derailment safety statistics that include 2022, the most recent complete year.
I am often asked about safety in the railway industry and why it is such a conspicuous topic with railroaders. Safety is priority number one—the first objective to secure—no matter the setting. A safety briefing is the first item of business on every meeting docket in the industry. A safety briefing is the first work task on every rail jobsite. Truly, “Safety First” is a way of life for railroaders.
With such an emphasis on safety, I have been asked if a railroad is an especially unsafe environment. When asked, I explain my definition of a safe environment—a place where a responsible person can leave an active and alert toddler unattended for half an hour. There aren’t too many places like that anywhere in the world. Everywhere else is a place where acceptable conditions of safety must be established and routinely assessed.
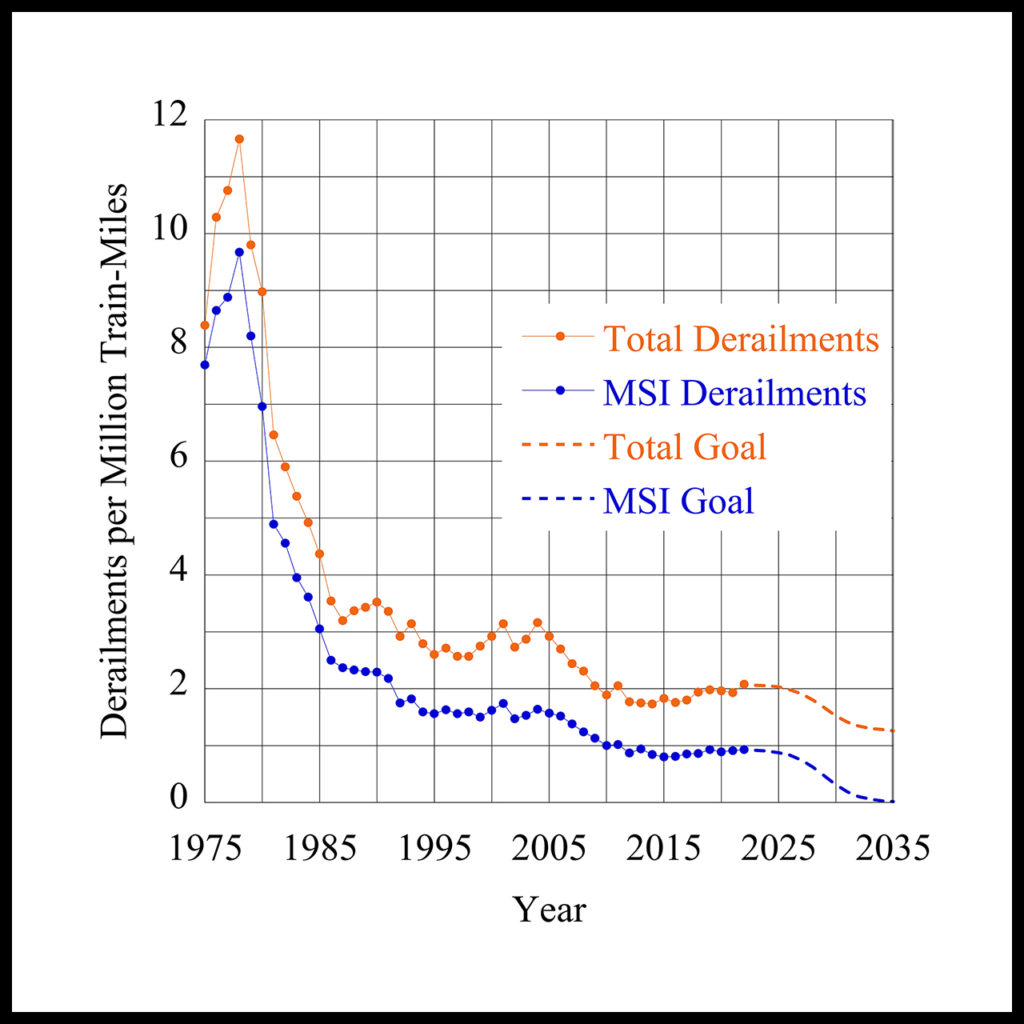
With that introduction, let’s look at some railway-specific safety statistics. We will focus on train derailments. All the datasets used herein are publicly available from the Office of Railroad Safety in the Federal Railroad Administration (FRA). They reflect the latest update available as of July 21, 2023. Figure 1 (above) is a graph illustrating the number of reported derailments per million train-miles for each year from 1975, the beginning of the FRA dataset, through 2022, the last full year of data available. Two sets of data are plotted in Figure 1 indicating the rate of derailments on all tracks in the U.S. (denoted “Total” in orange) and the rate of derailments on main line, siding and industrial tracks (denoted “MSI” in blue).
Let’s focus on the MSI data, since these tend to be the most consequential derailments, especially those occurring on main line track. As seen in Figure 1, there was substantial improvement between 1975 and 2010. Improvement from a high of 9.7 MSI derailments per million train-miles in 1978 down to 1.0 in 2010 represents an incredible 90% reduction.
The period from 1975 to 2010 deserves emphasis. During that time, maximum allowable interchange axle loads increased from 25 tons to 36 tons. That’s a 44% increase in direct loading, which substantially increased fatigue demand on critical steel components such as rail, rail welds and wheelsets. (Roughly for steel, fatigue demand increases with load raised to the third power, giving 1.44 x 1.44 x 1.44 = 3.0.) This remarkable safety outcome—tripling fatigue demand on critical components while reducing derailments by 90%—is the result of comprehensive, coordinated, multinational research efforts combined with strategic implementation of effective innovations.
During the 13 years since 2010, the U.S. MSI derailment rate has stagnated—ranging narrowly between 1.0 and 0.8 derailments per million train-miles and averaging 0.9. Nevertheless, there is an important and positive trend to acknowledge. In 1978, main line derailments represented 51% of total derailments (4,473 out of 8,765); in 2010, 31%, (410 out of 1,333); and in 2022, 24% (287 out of 1,212). Obviously, there remains room to improve, so where do we go from here?
Refer again to Figure 1. I have included a blue dashed line to illustrate a possible future main line derailment rate trend that approaches zero by the year 2035. The orange dashed line for the total derailment rate results from an added objective that derailments on other tracks, such as in yards, do not increase. After more than a decade of inertia, it is time to renew efforts to move the safety needle further, and there is a clear direction to focus those efforts.
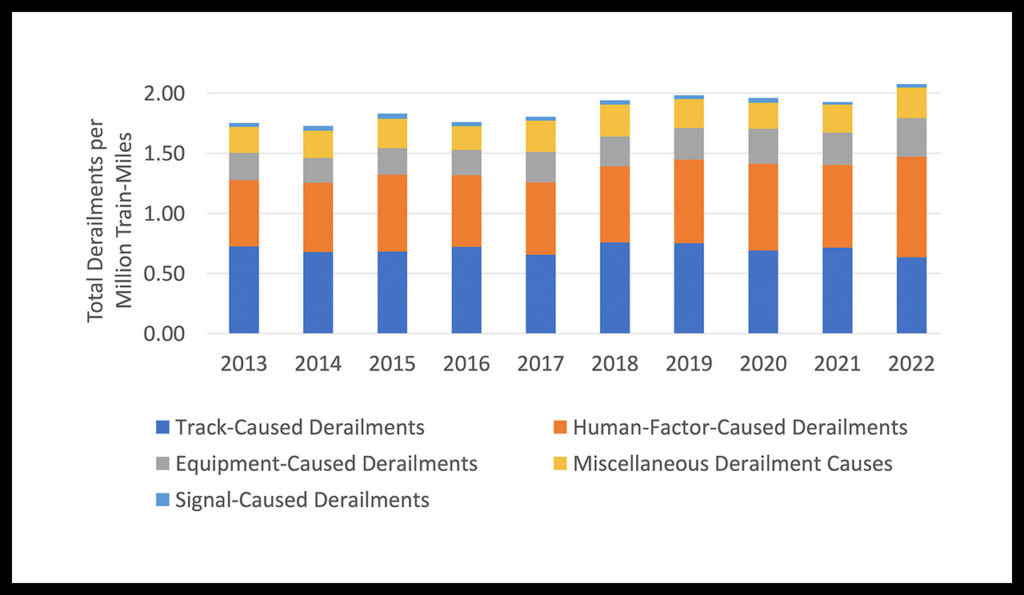
Derailments can be caused by many factors that can occur individually or in combination—usually the latter. Traditionally in the U.S., the causal factors are grouped into five categories: Track Factors, Human Factors, Equipment Factors, Signal Factors, and Miscellaneous Factors. Figure 2 (above) represents the most recent ten years of all reported derailment events in the U.S., including derailments on main line, yard, siding and industry tracks. The chart shows the annual breakdown of causal factors. In general, Track Factors and Human Factors are the predominant causes of recent derailments, together being consistently responsible for more than 70% of the total. What if we want to pursue the focus on improving main line derailment numbers?
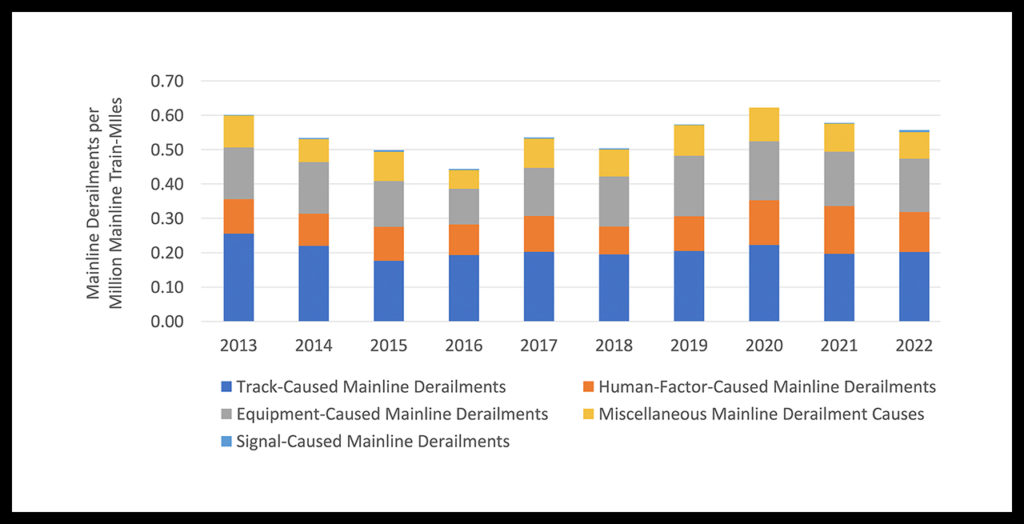
Over the past ten years, there has been an annual average of 322 main line derailments reported—nearly one per day. While Figure 2 covers all reported derailment events, Figure 3 (above) represents the number of main line derailment events reported over the most recent ten years. Figure 3 also shows the breakdown by causal factors. Consistently over this period, roughly 70% of main line derailments have been caused by Track Factors and Equipment Factors, which is different from the previous analysis of all derailments. Main line derailment safety is thus heavily weighted on improvements to track and equipment.
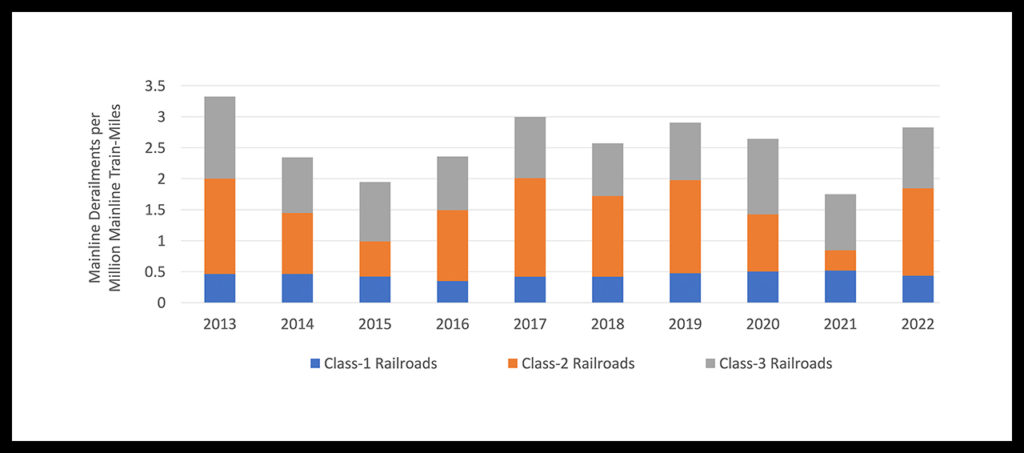
There are many ways to parse derailment safety statistics, and I will add just one more chart: Figure 4 (above)—main line derailment rates by class of railroad. As would be expected, the main line derailment rate on Class I railroads is the lowest, with one for every 2,000,000 miles of train operation. Class II and III railroads are generally more than double that rate. Although the main line derailment rate is an important safety performance indicator, the underlying number of main line derailment events is even more important. Consider the most recent ten years. Of the 322 main line derailments that occur on average annually in the U.S., an annual average of 222 occurred on Class I’s.
In summary, 1975 to 2010 were remarkable in terms of the challenges answered by the global heavy-haul freight rail transportation industry and its research partners. Today, many opportunities remain to enhance the safety of rail transportation. It is time to renew efforts toward innovation, investment, and implementation as we look to the future, perhaps guided by the dashed lines in Figure 1—elimination of all main line derailments by 2035.
Toward this objective, the “Five-I” model is simple but very effective, and has served the rail industry well in past decades—Identify, Invest, Innovate, Implement and Improve!

Dr. Fry is Vice President of Fry Technical Services, Inc. (https://www.frytechservices.com/). He has 30 years of experience in research and consulting on the fatigue and fracture behavior of structural metals and weldments. His research results have been incorporated into international codes of practice used in the design of structural components and systems, including structural welds, railway and highway bridges, and high-rise commercial buildings in seismic risk zones. He has extensive experience performing in-situ testing of railway bridges under live loading of trains, including high-speed passenger trains and heavy-axle-load freight trains. His research, publication, and consulting have advanced the state of the art in structural health monitoring and structural impairment detection.

![“This record growth [in fiscal year 2024’s third quarter] is a direct result of our innovative logistic solutions during supply chain disruptions as shippers focus on diversifying their trade lanes,” Port NOLA President and CEO and New Orleans Public Belt (NOPB) CEO Brandy D. Christian said during a May 2 announcement (Port NOLA Photograph)](https://www.railwayage.com/wp-content/uploads/2024/05/portnola-315x168.png)