Bureau of Transportation Statistics

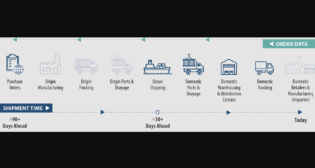
How It Works: FLOW Data Inputs and Outputs—Members of the FLOW program (e.g., beneficial cargo owners, ocean carriers, ports, terminals, railroads) share individual logistics data (highlighted in bold in the graphic above) with the USDOT and in return receive an aggregated, anonymized, and holistic view of the relationship between incoming containers (demand), the available assets to move containers (supply), and throughput within a supply chain region. Incoming demand is shared up to 90 days in advance of arrival. (USDOT Graphic)

USDOT Marks Milestone on Second Anniversary of FLOW

The Freight Logistics Optimizations Works (FLOW) platform is now publishing data on inland freight hubs, including rail terminal and warehouse end destination data, that will provide an “enhanced view” of future container import volumes and traffic, the U.S. Department of Transportation (USDOT) reported March 20, the second anniversary of the platform’s launch to provide an integrated view of supply chain conditions in the United States and to help users forecast how current capacity and throughput will fare against future demand.
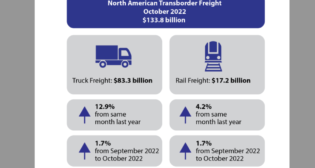
BTS: October 2022 Transborder Freight Up 13.9%

According to the most recent figures from the Bureau of Transportation Statistics (BTS), $133.8 billion of North American transborder freight was moved by all modes of transportation in October 2022, up 13.9% compared to the same month last year.

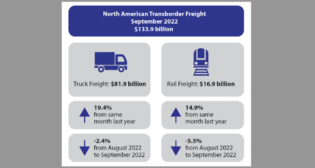
BTS: September Transborder Freight Up 22.6%

According to the most recent figures from the Bureau of Transportation Statistics (BTS), $133.9 billion of North American transborder freight was moved by all modes of transportation in September 2022, up 22.6% compared to the same month last year.

BTS: DOT-117 Compliance Tops 85%

According to the most recent figures from the Bureau of Transportation Statistics (BTS), the U.S. crude oil rail tank car fleet exceeded 85% compliance with DOT-117 safety standards, in 2021, up from 80% in 2020.