STB Issues Annual Rail Rate Index Study: 1985-2020
Written by Marybeth Luczak, Executive Editor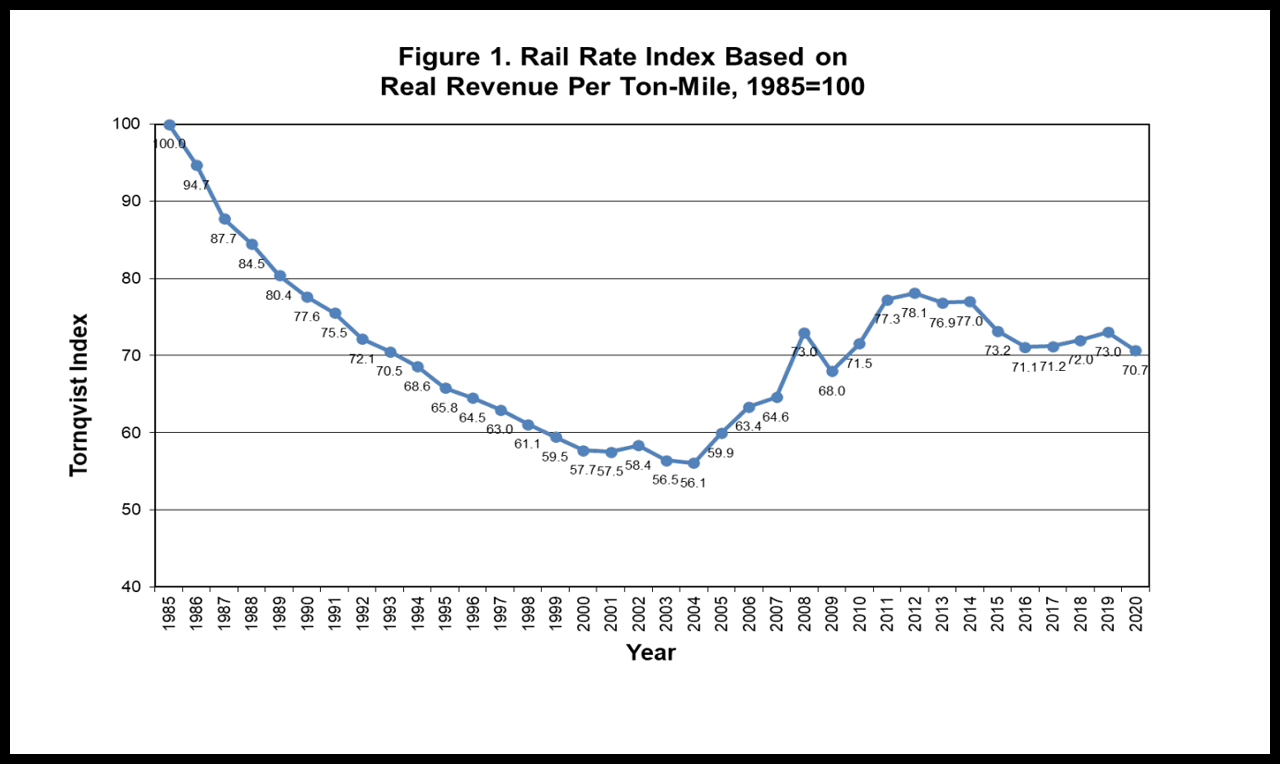
Figure 1 shows the real, inflation-adjusted Rail Rate Index over time. (Courtesy: STB Annual Rail Rate Index Study: 1985-2020)
The Surface Transportation Board’s Office of Economics (OE) has published the Annual Rail Rate Index Study: 1985-2020, summarizing trends in freight railroad rates.
The OE periodically distills its data and analysis of freight rail rates into formal reports to share with the STB and the public. It uses STB’s Confidential Carload Waybill Sample data for all traffic to calculate a “Tornqvist index” that shows how rates are changing over time across the entire rail industry, while controlling for shifts among different traffic characteristics from year to year, according to the agency.
The most recent report covers 1985 through 2020. It provides user-friendly graphs to represent real and nominal levels of revenue per ton-mile, and separates rail rates by commodity groups.
Download the Annual Rail Rate Index Study: 1985-2020 below: