Commentary
Precision Schedule? STB Review Might Actually Test This ‘Marketing Term‘
Written by Jim Blaze, Contributing Editor
Union Pacific photo
Where are the Class I railroads in improving their actual service metrics as the upcoming Union Pacific rail embargo STB investigation comes close to its Dec. 13-14 date in Washington? Following are summary observations and some independent commentary.
Background
The Surface Transportation Board (STB) on Oct. 28, 2022 ordered all Class I railroads to submit weekly performance and monthly employment data for six additional months. That new target would by May 5, 2023. The “Big Four” (BNSF, CSX, Norfolk Southern and Union Pacific ) must also submit biweekly service progress reports for another six months as well as an interim update that was due to be delivered on or about Dec. 2, 2022. Those reports also cover performance and labor force targets and any service recovery plan modifications.
Back on May 6, 2022—a little more than a week after its April 26-27 “Urgent Issues in Freight Rail Service” hearing—the STB voted unanimously to issue updated, more-comprehensive rules for reporting performance and employment metrics. That eight-part regulation, which mostly affect the Big 4, included filing of service recovery plans by May 20, followed by frequent progress reports and biweekly conference calls with STB staff.
The STB seemed to focus upon directing those four carriers to issue more comprehensive and customer-centric performance metrics. Plus, it wanted to see more in-depth railroad workforce employment data (beginning June 3, 2022). In essence, the STB took action to be able to, when warranted, address the acute service issues facing the rail industry and “to promote industry-wide transparency, accountability, and improvements in rail service.”
The early data initially reported back in May “revealed extensive service delays and reliability problems … For example, one carrier reported failing—more than half of the time on average—to deliver railcars in manifest service within 24 hours of the original estimated time of arrival (ETA) … The same carrier reported failing—about one-third of the time in multiple operating divisions, on average—on its FMLM (first mile/last mile) service … Another carrier reported failing—more than one-third of the time on average—to deliver grain and ethanol unit trains within 24 hours of the original ETA. … The early data also showed higher re-crew rates than those typically seen during periods of less network stress (i.e., approximately 5%).”
Note well that STB did specifically note that while “not all Class I carriers are experiencing service problems to the same degree, the U.S. rail system is an interconnected network and problems in one geographic area can quickly spread elsewhere. The application of certain reporting requirements to all Class I carriers allows the Board to assess the current service issues across the entire rail network.”
Meanwhile, in a logically related series of train performance incidents that resulted in the Union Pacific issuing embargoes on certain customer offered freight, the Board has now ordered UP President and CEO Lance Fritz and other top UP executives to appear at a Dec. 13-14 public hearing on what it’s calling a “substantial increase” in the Class I railroad’s use of embargoes as a method of reducing rail traffic congestion. Without making any pre-conference comments or hypothetical conclusions, let’s just take a look at what some of the current railroad reports are showing as patterns. We can use that as background notes when the hearing takes place.
What does the overall performance look like, and what’s really being captured that is informative to both the regulators and to the rail freight customers? All of the data is being submitted subject to the Board’s oversight authority under 49 C.F.R. Part 1250.3.
The first revised data showed that the Big 4 cited currently meeting some of their six-month targets for service improvement, and that many key performance indicators are trending in a positive direction. However, the Board technical review found that the submitted data continue to validate the anecdotal customer point of view regarding significant service issues.
Key performance indicators now include:
- System Train Velocity.
- Terminal Dwell.
- First-Mile/Last-Mile (FMLM) switching service (i.e., industry spot and pull, ISP.
- Operating Inventory.
- Trip plan compliance (TPC).
The data review conclusion is that railroad operations remain challenged generally, particularly when compared to pre-pandemic 2019 levels. Therefore, at this time, continued SB monitoring is needed. Let’s highlight what each railroad is reporting against what some of some of the rail sector investor analysts are reporting. The data tables are taken from the STB review and updated decision announcement of Oct. 28, 2022. When reviewing these table summaries for each carrier, keep in mind that the target for improvement by many of them (but not all) is stated as the performance achieved back in 2019.
Below are the latest tabular summaries by carrier as assembled by the STB staff. Then there is a public commentary offered by STB with reference to these report cards. Here are a few carrier definitions as to their goal or target metrics. The following examples are taken from Union Pacific. Readers are advised to look up each carrier’s definition modifications because one carrier might not use the exact same definition or math calculations:
UP’s car velocity indicator measures the average daily miles a car moves on the network. Operating inventory represents UP’s active inventory minus cars placed at rail user facilities. UP intends to decrease its operating inventory because UP contends that a surplus of operating inventory is a primary contributor to network congestion.
Cars per carload represents the operating inventory required to generate one revenue carload. It is calculated by dividing operating inventory by the average daily number of revenue carloads. UP intends to decrease its cars per carload metric, which would signify that it is using fewer freight cars to move shipments across the UP network. Note that “total cars” appears to also to mean shipper-owned/leased cars that UP has on its network. Also note that the terms “merchandise” and “manifest” typically refer to the same kind of mixed carload traffic.
BNSF
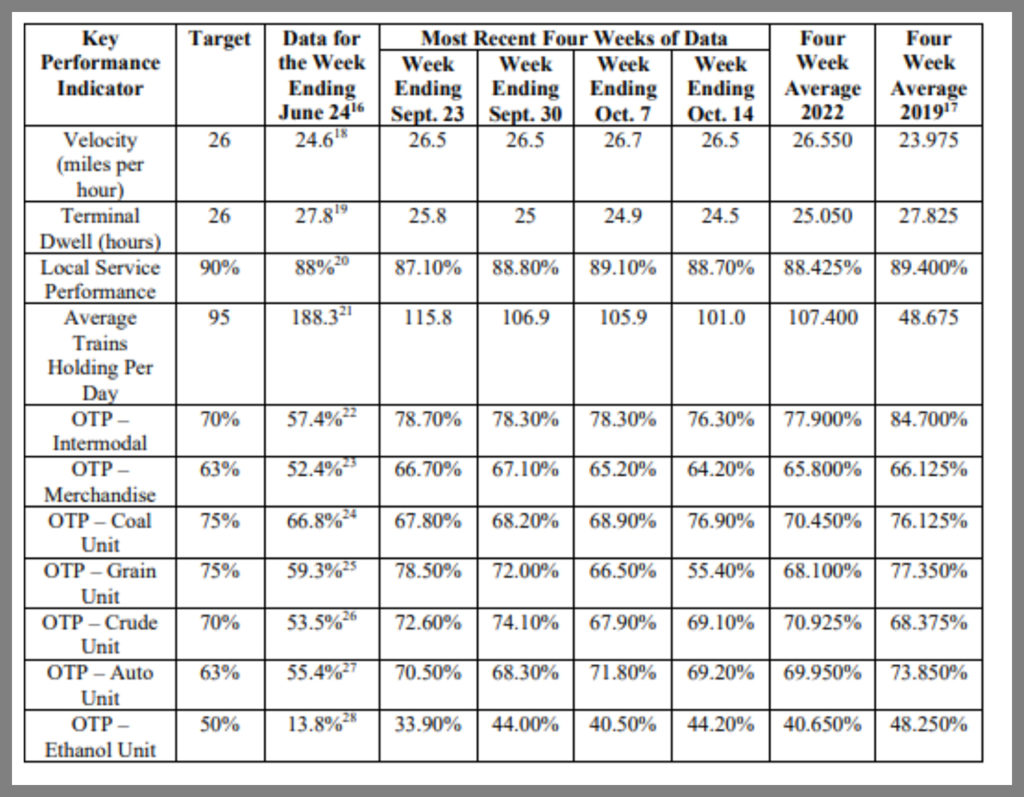
STB observations: The BNSF table above indicates that BNSF has not yet met its targets for local service performance and average trains holding per day. With respect to OTP, BNSF has been consistently above its targets for intermodal and merchandise traffic in recent weeks, although BNSF’s performance in several unit train categories has fluctuated above and below its targets.
In its latest October progress report, BNSF explains that its performance levels for grain unit trains decreased during the week ending Oct. 7 due to the bunching of trains at the beginning of soybean season. According to BNSF, this fluctuation occurs each year and its current performance is within the bounds of the variability it has seen in recent years. Additionally, BNSF’s recent performance shows improvement compared to its 2019 velocity and terminal dwell metrics. However, recent data for local service performance, average trains holding per day, and most OTP metrics indicate that these indicators on average have not yet returned to 2019 levels.
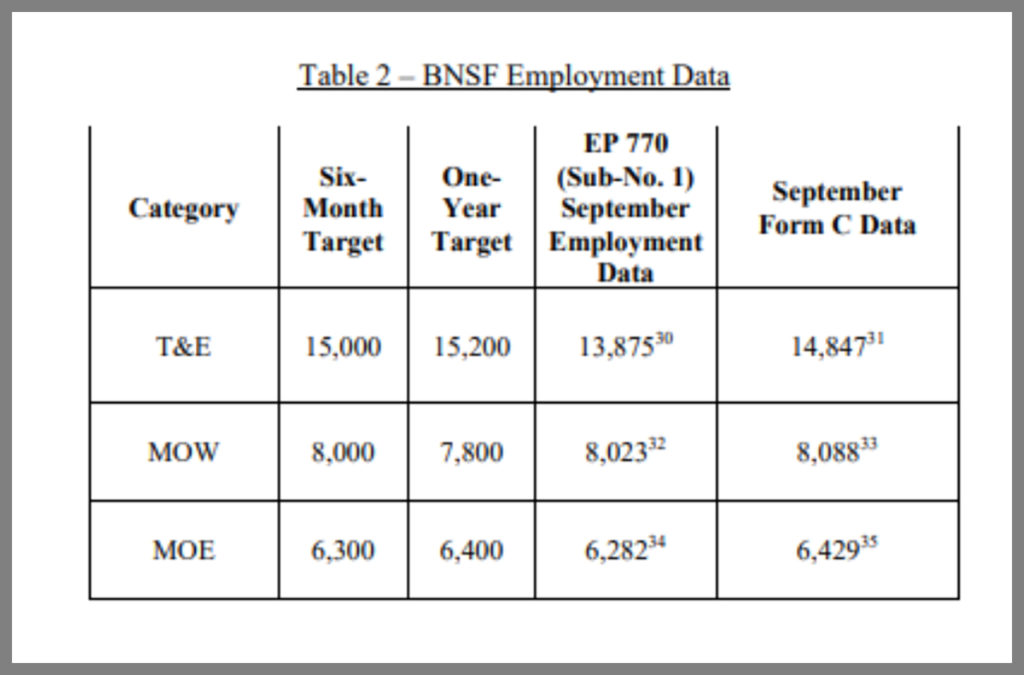
BNSF labor: For its labor force targets, BNSF stated that it expects to employ 15,000 T&E employees at six months (15,200 employees in one year), 8,000 MOW employees at six months (7,800 employees in one year), and 6,300 MOE employees at six months (6,400 employees in one year. However, the STB found that BNSF is far from its T&E target when compared to the September monthly employment data in this docket for employees actively on the job.
The STB did go so far as to compare, in its Table 2, BNSF’s progress to both the total number of employees on the payroll (as shown in BNSF used data source) and against the number of employees actively on the job. It concluded that as demonstrated in BNSF’s Table 2, under either comparison data set, BNSF has not met its T&E target. The Board remains as of late October concerned with BNSF’s ability to meet its target for T&E employees.
Norfolk Southern
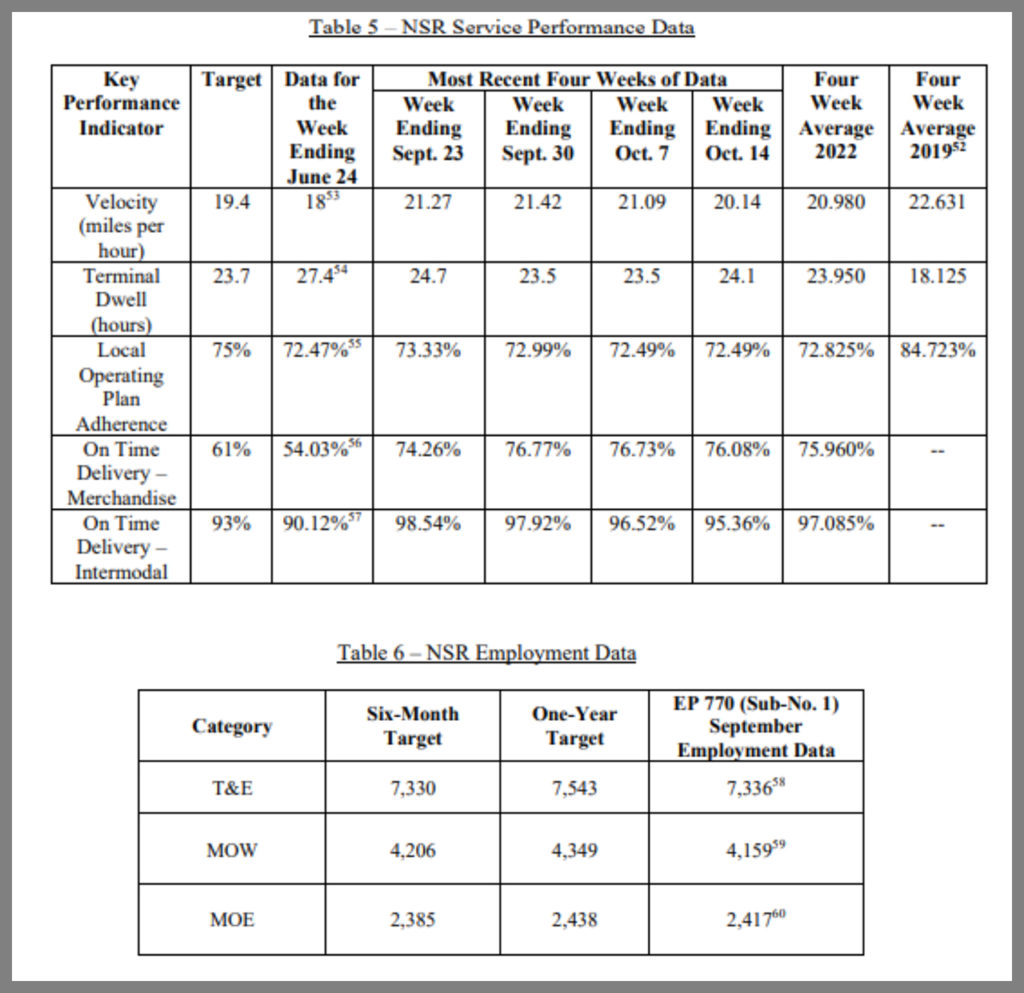
NS identified system velocity, terminal dwell, local operating plan adherence, and on-time delivery as its key performance indicators. NS stated that, at the end of the six-month period, it expects to achieve a system velocity target of 19.4 mph, a terminal dwell target of 23.7 hours, and a local operating plan adherence target of 75%. For on-time delivery, NS stated that its targets are 61% for merchandise traffic and 93 % for intermodal traffic.
The STB concluded in late October that “NS has consistently exceeded its velocity target in recent weeks, as well as its targets for on time delivery of intermodal and manifest traffic.” Additionally, NS has met its terminal dwell target in some recent weeks. However, as shown in Table 5, the recent data show that NS is not yet consistently meeting its local operating plan adherence target. NS velocity, terminal dwell and local operating plan adherence have not returned to 2019 levels.
For its labor force targets, NS stated that it expects to have 7,330 T&E employees at six months (7,543 employees in one year), 4,206 MOW employees at six months (4,349 employees in one year), and 2,385 MOE employees at six months (2,438 employees in one year). However, as shown in Table 6, while NS has met its six-month T&E and MOE targets when compared to the monthly employment data submitted in this docket, it has not met its MOW target, although that figure may be affected by the seasonal nature of maintenance work.
CSX
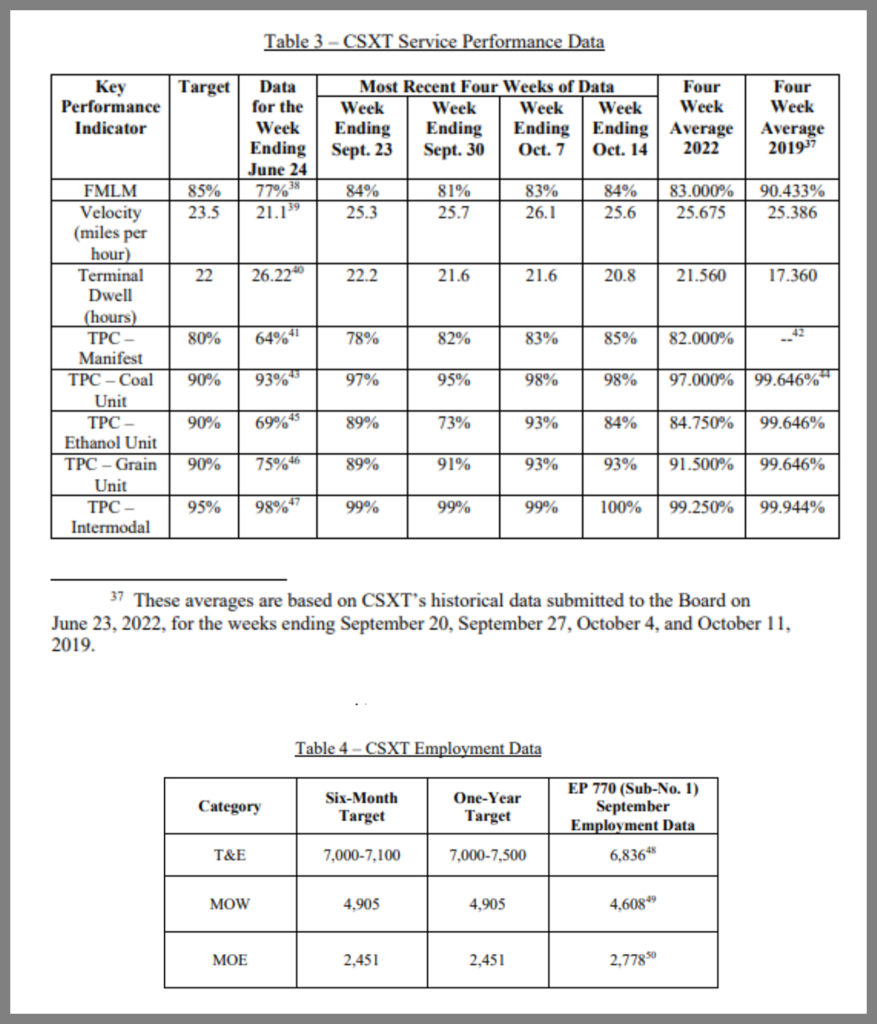
CSX stated that, at the end of the six-month reporting period, it expects to achieve a FMLM target of 85%, a velocity target of 23.5 mph, and a terminal dwell target of 22 hours. CSX also stated that it expects to achieve TPC for manifest traffic at or above 80%, TPC for aggregate unit train traffic (including grain unit, coal unit, automotive unit, crude oil unit, and ethanol unit) at or above 90%, and TPC for intermodal traffic at or above 95%. Table 3 is CSX’s reported data used for this STB updated review.
For its labor force targets, CSX initially stated that it expects to have 7,000 to 7,100 T&E employees at six months (7,000 to 7,500 employees over the next one to two years),and 4,905 MOW employees at six months
As shown in Table 4, STB concluded that CSXT has not met its T&E target when compared to the monthly employment data submitted in the docket. Furthermore, while CSX has not yet achieved its MOW target, CSX has achieved its MOE target, although both figures may be affected by the seasonal nature of maintenance work.
The STB offered this conclusion in its Oct. 28 decision: “Given issues raised in this docket, and absent any indication or explanation from CSX on this record that it has changed its target, the Board is most concerned with CSXT’s ability to meet its targets for T&E employees.”
Union Pacific
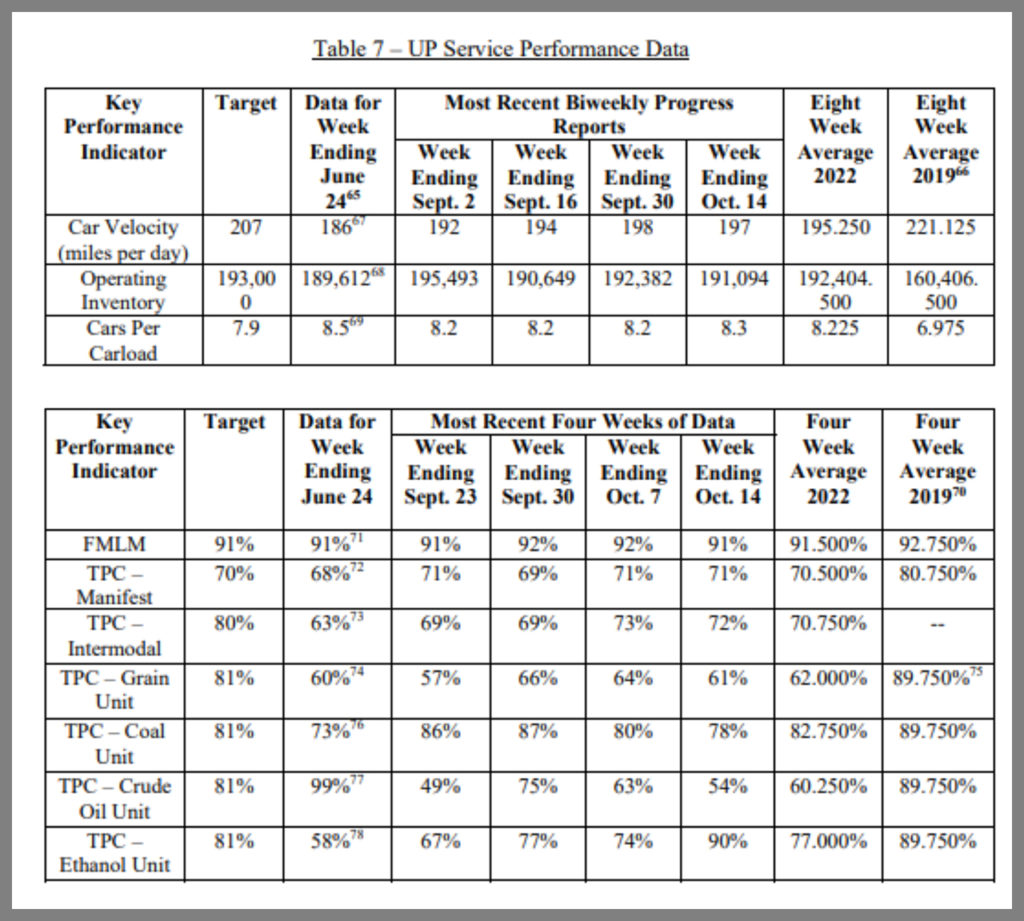
UP identified car velocity, operating inventory, cars per carload, FMLM, and TPC (Trip Plan Compliance as a completed delivery against planned final ETA) as its key performance indicators. UP stated that, at the end of the six-month reporting period, it expects to achieve a car velocity target of 207 miles per day, an operating inventory target of 193,000 cars, a system average of cars per carload target of 7.9, and a FMLM target of 91%. For TPC, UP stated that its targets are 70% for manifest traffic, 80% for intermodal traffic, and 81% for aggregate bulk traffic.
As shown in Table 7, the data indicate that UP’s performance is consistently below its targets for velocity and TPC for intermodal, grain unit, and crude oil unit traffic. Furthermore, UP has not yet met its target for cars per carload. In several recent weeks, UP’s operating inventory has been below its target, signifying that it has made some positive steps towards reducing network congestion.
UP has met its FMLM performance target and its TPC targets for manifest and coal unit traffic in several recent weeks. However, UP’s recent data for all indicators (i.e., FMLM, car velocity, operating inventory, cars per carload, manifest and unit train TPC) show that on average they have not yet returned to 2019 levels. (STB footnote: In its interim update, UP is directed to advise the Board about whether its goal is to return service to 2019 levels and then improve further upon that baseline, as the other carriers have indicated, or whether it has a different long-term goal.)
For its labor force targets, UP stated that it expects to have 11,300 T&E employees at six months (11,400 employees in one year); 9,000 engineering employees79 at six months (9,000 employees in one year); and 3,850 mechanical employees at six months (4,200 employees in one year). However, the STB said it is unable to compare UP’s progress to the monthly employment data in the docket that tracks employees actively on the job. As shown in Table 8, UP exceeded its six-month T&E target by approximately 2,000 employees in September when compared to the number of employees actively on the job—a discrepancy that suggests that UP included different groups of employees in the T&E target it provided with its revised service recovery plan and the number of T&E employees actively on the job.
STB directed UP to explain this discrepancy in its interim update, and provide six-month and one-year labor force targets for employees actively on the job (using the same timeframe starting point as its key service performance indicator targets) that the Board can track against the monthly data UP is submitting in the docket. Upon further review, the Board saw that in its revised service recovery plan, UP asserted that it planned to add 1,400 T&E employees in 2022 for a net increase of 400 new T&E employees when factoring in attrition. However, to certain other data, between May and September, UP added only 70 active T&E employees.
STB’s Formal October 28, 2022 Findings
In addition to the specific issues addressed above in the discussions of each carrier’s recent data, the STB said it “will order each of the Four Carriers to include an interim update with the following information:
- “Because the Board is extending the temporary reporting period for another six months, the Four Carriers are directed to submit targets that they expect to meet at the end of the extended temporary reporting period for each of their key performance indicators.
- “CSX and NS may, if necessary, update their labor force targets submitted in response to the June 13 Order. BNSF and UP must update their labor force targets. Each carrier is also directed to include an explanation for any labor force target modifications.
- “If any of the Four Carriers have made other modifications to their service recovery plans as submitted to the Board, those carriers should provide the Board with details about changes they have made or intend to make to achieve their longer-term success. If a carrier does not intend to make any changes, those carriers should so indicate.
“Based on the progress shown in the ensuing reporting from the Four Carriers, the Board will determine whether any further public hearings are warranted in this docket.
“It is ordered:
- “BNSF, CSXT, NS, and UP shall submit the interim update described above on December 2, 2022.
- “BNSF, CSXT, NSR, and UP shall continue to submit biweekly service progress reports for an additional six-month period, until May 5, 2023.
- “All Class I railroads shall continue to submit weekly performance data and monthly employment data in this docket for an additional six-month period, until May 5, 2023.”

Independent railway economist and Railway Age Contributing Editor Jim Blaze has been in the railroad industry for close to 50 years. Trained in logistics, he served seven years with the Illinois DOT as a Chicago long-range freight planner and almost two years with the USRA technical staff in Washington, D.C. Jim then spent 21 years with Conrail in cross-functional strategic roles from branch line economics to mergers, IT, logistics, and corporate change. He followed this with 20 years of international consulting at rail engineering firm Zeta-Tech Associated. Jim is a Magna Cum Laude Graduate of St Anselm’s College with a master’s degree from the University of Chicago. Married with six children, he lives outside of Philadelphia. “This column reflects my continued passion for the future of railroading as a competitive industry,” says Jim. “Only by occasionally challenging our institutions can we probe for better quality and performance. My opinions are my own, independent of Railway Age. As always, contrary business opinions are welcome.”