It’s Now an STB Moment
Written by Jim Blaze, Contributing EditorThe Class I railroads have responded to the Surface Transportation Board’s strategic question: “Are You Prepared?” Shippers should look for certain signals.
Remember bringing your high school report card home, at an age when we were actually cognizant of our maturing, as a sophomore or a junior, perhaps after a quarterly grade stumble? For me it was in Geometry. I’d stumbled out of the semester gates in memorizing the basic theorems. It wasn’t my teacher Mr. Forbes’ fault. It was mine.
Mom and dad were diligent parents who deserved a proper explanation. They wanted their four children to get a college education. But the ticket would have to be an educational scholarship. That moment at the kitchen table was my game-changer about character development. No BS allowed. Dad, a World War II European combat veteran, wouldn’t accept that. So, I laid out a specific study plan, accepted a social grounding, and asked mom for help because she was excellent in math. And I laid out a specific measurable improvement plan with grade targets.
I got my only D up to a C+ and closed out the grading with a B-, subpar overall for Geometry, but enough to boost my graduation rank to a top ten. Yep, I got the scholarship.
My point? STB Chairman Martin Oberman’s letter to the chief executives of the Big Seven Class I railroads set the table for a similar “show us please” response. He called on them to provide an update on their preparedness to meet service demands, particularly as railroad employment rates have fallen.
There is concern that promised Class I market share growth is stalling. Reasonably, Oberman asked the CEOs for their self-produced report card—not a teacher’s grading; not even a customer’s grading. This is a flashback to my kitchen table discussion with my parents.
Here is this railroad economist’s review. Yours may well be different.
I see the replies signaling two things. First, the extent to which these executives and their organizations are quantitate-driven. Second, whether there exists a processing difference within the STB itself as it reads the letters and responds to the executives. Accepting the responses as submitted without a comment as to substance would be one possible STB indicator of intent. But there could be another, discussed later below. Here is what I’m is looking for.
NEW BENCHMARKS
Perhaps I’m not qualified to grade each railroad’s submission. And I’m not a substitute parent or a duly appointed regulator. But I am a qualified, street-wise rail freight economist. My career has touched some of the best and some of the worst. I focus on finding the critical numbers and the momentum patterns, each at a strategic perspective.
From my work experience, one letter stands out here. It speaks to me in positional metrics. BNSF’s Katie Farmer cut to the chase, taking a full three pages for her June 9, 2021 explanation, but marking numerical momentum points. Here are some measurement takeaways:
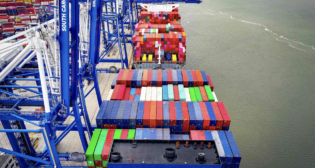
Perhaps one of the biggest BNSF service delays is intermodal drayage and terminal congestion—admittedly, historically high container dwell and chassis shortages resulting in service delays as much as 48 hours longer than normal seen at the receiving customer’s dock.
BNSF train operations are continuous 24/7 . Some of the origins and empty container returning container trains are being delayed because destination yards and ports are congested. As an example, some of BNSF’s westbound intermodal flow is restricted into various terminals.
Another congestion management area cited is that involving logistics visibility. Today, BNSF sees an average of ~11,000 customer daily ‘hits’ (visits) to its internet accessible Customer Portal used for tracking shipments location and progress “at all times” while on the BNSF network. The “at all times” description might more accurately reflect that out along the railroad, events are not actually always continuously communicated, at least not yet. Similar to the other Class I’s, BNSF says that it is continuing to expand its communications systems.
BNSF weekly volume recovery for all kinds of car units is an interesting statistic. Historic weekly volumes were in the range of 200,000 units moved. During the depth of the pandemic, they dropped significantly to ~150,000 units. Since the beginning of the year, BNSF has seen eleven weeks at the more-than-200,000 units scale.
Locomotive shortages are often cited by others as a major congestion predictor. BNSF currently has 4,865 high-horsepower, main line long-haul locomotives in service. It cites that it has reserve units, but doesn’t footnote the size of the reserve fleet. Allowing for returning growth, a nominal reserve might be in the 5% to 8% range. Reserve locomotives units in storage is an interesting comment, but a return-from-storage process can often be lengthy. Without that citation process, the comment is less meaningful to the STB.
As for on-line system cars, BNSF compared its current 2021 status to the base year of 2019. Currently, BNSF has ~208,000 active cars, an increase of just 1.5% over 2019, but as much as 39% over 2020. A more meaningful comparison for the STB might have shown the 2021 situation as a percentage change over 2018, a really good year.
BNSF does note that there is an important market differentiation about the number of freight cars. Not surprisingly, coal cars are down 28% compared to 2019, while cars for finished motor vehicles are up 195% since 2019. Important to note is that active intermodal cars on BNSF are up 41% since 2020 and 20% since 2019. But where are they when compared to base year 2018?
Railroad employee counts are increasing. BNSF cites having just over 1,500 Train & Engine and Yard Service employees remaining on furlough, down from just over 3,000 furloughs at the end of January. BNSF cites a range of 15% to 35% of its intermodal facility workforce furloughed, depending upon location.
LONGER-TERM SOLUTIONS
In digesting the BNSF response, the STB might want to further explore other solutions not specifically addressed in BNSF’s current letter. Here are a few businesses examples STB can consider.
BNSF’s intermodal fluidity relies in part upon the “partnering” capacity and performance of trucking and ocean carrier partners, as well as beneficial cargo owners effectively managing their own supply chains (logistics pipelines) and efficiently turning chassis pools. BNSF and its intermodal heavy asset partners like the ports need to be willing to operate 24 hours a day, 7 days a week. Otherwise, they become “a weakest link” congestion reality. As an observation, the longer-term solution might itself require redesigned BNSF intermodal yards and parking slots at selected intermodal yards.
Shipment level by customer rather than by BNSF railcar tracking might be the next breakthrough for improved supply chain management. That would mostly replace the periodic reports whenever a car moves past an isolated AEI tag reader and gets combined with other train-based car-location messaging. That’s going to require one of the almost constantly monitored new technology sensors promised by multiple IT vendors, or perhaps combining locomotive PTC train location data packets against more-robust data ase matching programing as an alternate solution. It’s complicated, but there are competing solutions already tested and capable of rapid introduction.
STB Commissioners and staff need to get up to speed with such digital age utilities as an option to building more tracks and yards. I offer this rebalancing reminder: While it’s good to see a recovery in process for rail freight, but as to a possible intermodal growth engine, keep in mind that overall, the rail intermodal CAGR (compound annual growth rate) has probably dropped to less that 1.8% annually since 2018, though it is higher in a few strategic rail market lanes.
The next time the STB sends out a request, the Class I’s might want to use a few visuals. As examples, take a look at the below BNSF graphs courtesy of Bascome Majors at SFG (Susquehanna Financial Group) show the percentage of on-time delivery performance during the past six quarters. Was it improving steadily toward 90% or higher for carloads, or more in the 70% to 85% range? Was intermodal in the actual ETA delivery range of 95% and up holding or improving?
The response letters missed that opportunity to show each railroad’s report card in a graph. Do better, please, next time. Go for the Golden Buzzer. To each carrier, I simply sugest that these responses are your opportunity to be customer-centric. Seize that high ground the next time the STB asks you for your upcoming status.
BNSF’s longer-term volume graphics courtesy of SFG’s Bascome Majors illustrate the power of using visual representations over time. Clearly, while BNSF is rebounding, it is not yet seeing significant market shift growth.
Meanwhile, STB should note that the BNSF’s overall network train movement velocity has not yet returned to its prior performance levels. Why not? Will it return? Is higher velocity a public benefit? What’s the STB response?
As to the overall U.S. freight railroad fluidity, consider this all-Class I SFG graphic. Does the STB have an SFG subscription?
The Class I’s say that one railroad’s performance cannot be compared to the others with such data sets. But in the commercial world, that argument does not hold up, because they all compete. This is how the market sees them.
How will this relatively new group of STB Commissioners set the tone of their oversight role? Will they be debating and legalistic in their interpretation of report cards? Will their review be quantitative? Will it be like a 17-year-old’s concerned parents offering help and life lessons? There could be a dynamic at work here in the letter reading and interpretation, or the STB consensus response could simply be a rather flat and neutral reaction. I’m not predicting. I’m watching, with interest.
The nature of the Commissioners’ response will tell us something about how the merger reviews and the public-benefits technical procedural matters may or mat not be changing. If the STB signals that it appears to be more focused upon metrics and grade results, then I’d predict that the railroads’ “theory” of their business/public benefits case preparation will likely have to undergo a serious kitchen table review. Filings might not be business as usual as to substance and logic. However, the STB might signal a traditional appraisal role, accepting qualitative word-smithing and fewer quantitative requirements If more quantitative, will that signal a merely procedural and past-precedent review role rather than substantive technical processing?
Bear in mind that the STB’s statutory authority is quite limited when it comes to operations and equipment availability. Note that a condition of past mergers was for the STB to involve itself in such affairs, but it was a condition of merger approval. Otherwise, there is a bully pulpit, but it is significant that none of the other members signed on to Oberman’s letter.
Independent railway economist and Railway Age Contributing Editor Jim Blaze has been in the railroad industry for more than 40 years. Trained in logistics, he served seven years with the Illinois DOT as a Chicago long-range freight planner and almost two years with the USRA technical staff in Washington, D.C. Jim then spent 21 years with Conrail in cross-functional strategic roles from branch line economics to mergers, IT, logistics, and corporate change. He followed this with 20 years of international consulting at rail engineering firm Zeta-Tech Associated. Jim is a Magna Cum Laude Graduate of St Anselm’s College with a master’s degree from the University of Chicago. Married with six children, he lives outside of Philadelphia. “This column reflects my continued passion for the future of railroading as a competitive industry,” says Jim. “Only by occasionally challenging our institutions can we probe for better quality and performance. My opinions are my own, independent of Railway Age. As always, contrary business opinions are welcome.”
FOOTNOTE
“In 1966, Congress authorized the ICC to prescribe a demurrage incentive element to improve car utilization and encourage acquisition of new freight cars. See Increased Per Diem Charge on Freight Cars, 268 ICC 659 (1947); Palmer vs. U.S., 75 F.Supp. 63 (1947); Railroad Freight Car Supply, 80 Stat. 168 (1966); Ex Parte No. 252, Incentive Per Diem Charges, 332 ICC 11 (1967); and U.S. vs. Florida East Coast Railway, 410 U.S. 224 (1973).
“Additionally, railroads have a common-carrier obligation to provide service on reasonable request, supply adequate car service, maintain switch connections and facilities for the interchange of traffic, and establish through routes. Note that traffic moving under contract, or otherwise exempt from economic regulation, generally is not subject to the railroads’ common carrier obligation.
“In 2008, the STB said “the common carrier obligation refers to the statutory duty of railroads to provide transportation or service on reasonable request” Ex Parte No. 677, Common Carrier Obligation of Railroads (served Feb. 27, 2008). A 2015 congressionally funded Transportation Research Board report, Modernizing Freight Rail Regulation, said that the common carrier obligation ‘remains poorly defined.’” – Frank N. Wilner
Wilner’s new book, Railroads & Economic Regulation, is to be published this summer by Simmons-Boardman Books.


