Identify, Invest, Innovate, Implement, Improve
Written by Gary T. Fry, Vice President, Fry Technical Services, Inc.; Railway Age Contributing Editor
RAILWAY AGE AUGUST 2022 ISSUE: Derailment safety in the U.S., 1975 to 2021—and goals for the future.
Welcome to “Timeout for Tech.” In this series, we examine a technology topic that professionals in the railway industry have asked to learn more about. In this installment, we focus on high-level derailment safety statistics, including the most recent complete year, 2021. Each year going forward, we will dedicate an article to providing a derailment safety update.
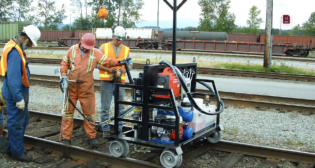
I am often asked about safety in the railway industry and why it is such a conspicuous topic with railroaders. Safety is priority number one—the first objective to secure—no matter the setting. A safety briefing is the first item of business on every meeting docket in the industry. A safety briefing is the first work task on every rail jobsite. Truly, “Safety First” is a way of life for railroaders.
With such an emphasis on safety, I have been asked if a railroad is an especially unsafe environment. When asked, I explain my definition of a safe environment: a place where a responsible person can leave an active and alert toddler unattended for half an hour. There aren’t too many places like that anywhere in the world, and everywhere else is a place where safety is a concern that should be assessed and planned for. From that point of view, the railroader’s special emphasis on safety is not an indication that a railroad is an unusually unsafe environment. Rather, it’s an indication that railroaders are especially aware—they “get it” and are committed to finding ways to make their industry safer—for all their stakeholders.
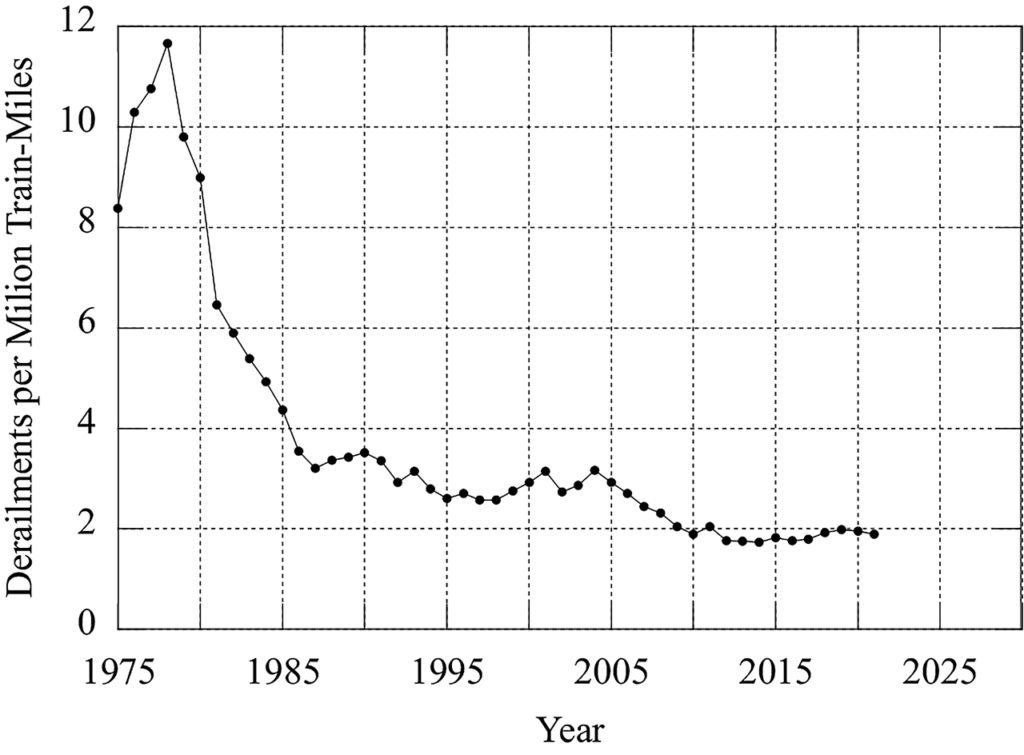
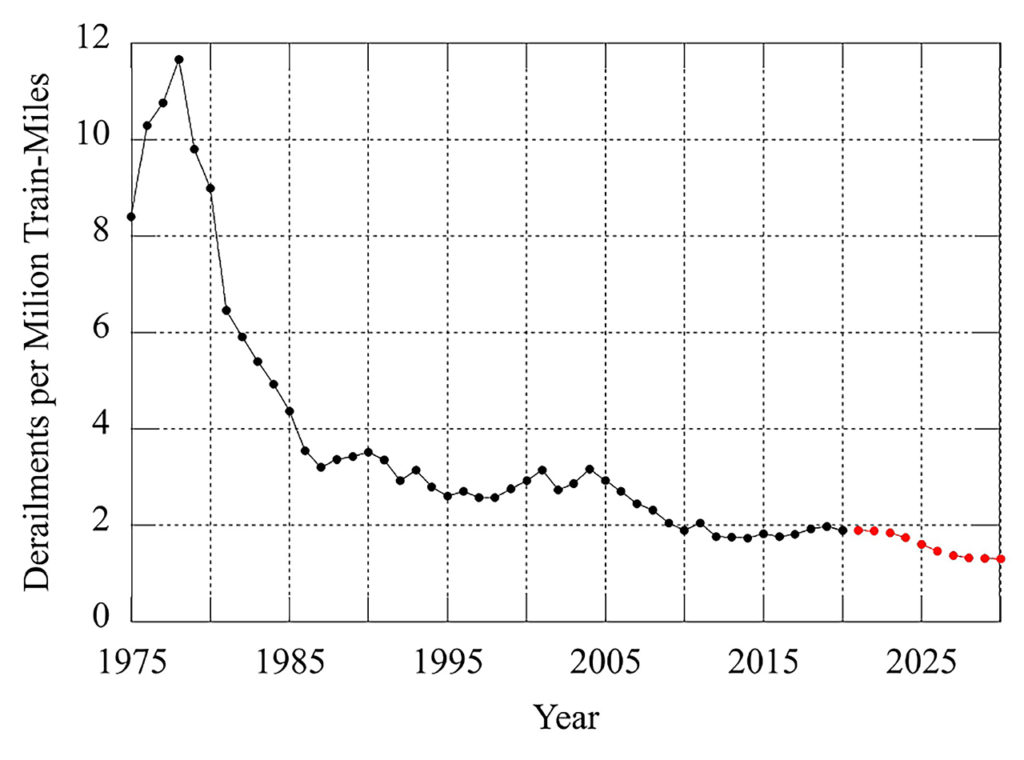
With that introduction, let’s look at some railway-specific safety statistics. The data sets used in this article are publicly available from the Office of Railroad Safety in the Federal Railroad Administration (FRA). We will focus on a safety issue unique to the industry—train derailments. Figure 1 is a graph illustrating the number of reported derailments per million train-miles for each year from 1975—the beginning of the FRA data set—through 2021—the last full year of data available.
In the data sets, we observe remarkable past progress but recent stagnation. As seen in Figure 1, there was substantial improvement between 1975 and 2010. From a high of 11.7 derailments per million train-miles in 1978 down to 1.89 in 2010 represents an 84% reduction. Since 2010, there has been no further reduction trend in derailment rate. It has ranged narrowly between 2.0 and 1.7 derailments per million train-miles while averaging 1.8.
The period between 1975 and 2010 deserves some emphasis in discussion. Over this period, maximum allowable interchange axle loads increased from 25 tons to 36 tons. That’s a 44% increase in direct loading that gives rise to a 200% increase in fatigue demand on critical steel components such as rail, rail welds and wheelsets. (Roughly for steel, fatigue demand increases with load raised to the third power, giving 1.44 x 1.44 x 1.44 = 3.0.)
This remarkable safety outcome—tripling fatigue demand while reducing derailments by 84%—is the result of comprehensive, coordinated, multinational research efforts. The work accomplished by the many research and development teams representing industry, government and academia had a dramatic impact. Guided by the research results, suppliers around the world innovated and developed new rail steel, new rail welding materials and procedures, new alloys for special trackwork castings, new wheel alloys and wheel plate designs, new axle designs, new bearing alloys and designs, new designs for bogie systems, new railcars and more. Of equal and critical significance, the railway companies were able to make the necessary investments to implement the innovations, which made the safety improvements possible.
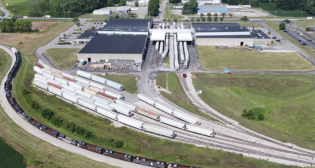
After more than a decade of inertia, it might be time to consider renewed efforts to materially move the safety needle further, and there is a direction to focus those efforts. Every derailment has associated likelihoods of serious, undesirable outcomes. Derailments in yards primarily impact system fluidity causing temporary, short-lived economic losses while also posing injury risks to train crews and workers in the yards. Derailments at main line track speeds, however, are especially likely to be consequential in both human and economic terms. Hence, to substantially improve safety on an annual basis, it is necessary to reduce the total number of annual main line derailments.
Safety improvement, in this sense, is not a question of derailment rate; rather, it is an issue of derailment occurrence, especially at main line train speed. For a given year to be safer than another, it must have fewer main line derailments. Figure 2 is a graph very similar to Figure 1, except that it illustrates a future derailment rate trend that approaches 1.3 by the year 2030. This target represents eliminating all main line derailments, i.e., 30% of the current total number of derailments. It might be beneficial from a safety point of view to do more, but eliminating all main line derailments is a direct and impactful challenge goal to identify.
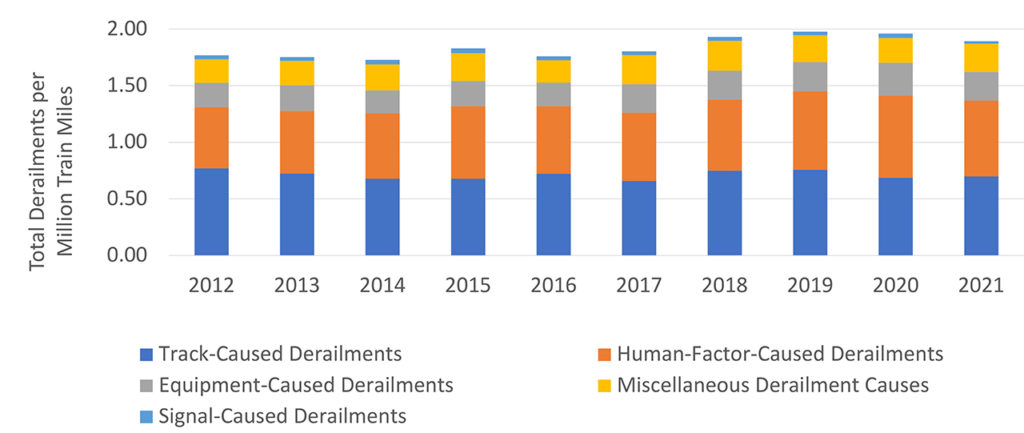
Derailments can be caused by many factors that can occur individually or in combination—usually the latter. Traditionally in the U.S., the causal factors are grouped into five categories: Track Factors, Human Factors, Equipment Factors, Signal Factors, and Miscellaneous Factors. Figure 3 is a chart representing the most recent 10 years of all reported derailment events in the U.S., including derailments on main line, yard, siding and industry tracks. The chart shows the annual breakdown of causal factors. In general, Track Factors and Human Factors are the predominant causes of recent derailments, together being consistently responsible for more than 70% of the total. What if we want to pursue the focus on improving main line derailment numbers?
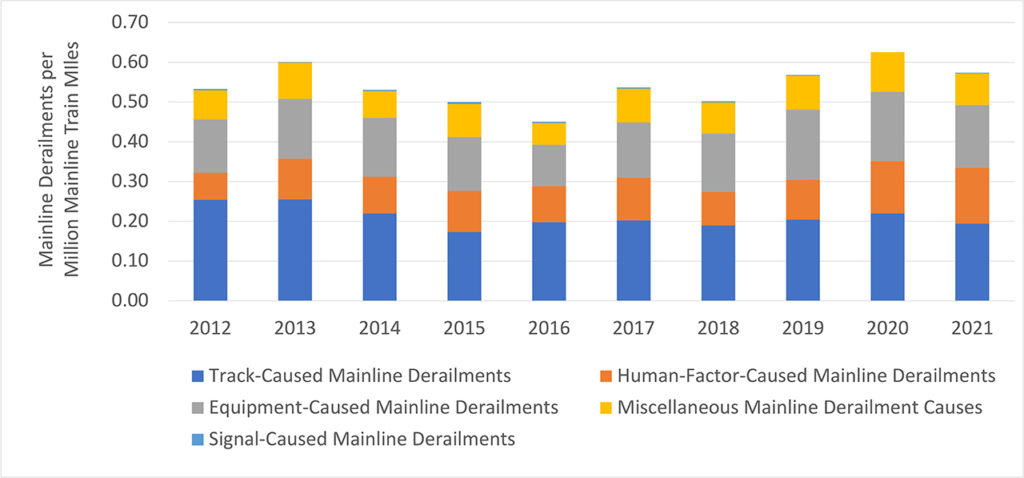
Over the past 10 years, there has been an annual average of 328 main line derailments reported—nearly one per day. While Figure 3 covers all reported derailment events, Figure 4 is a chart representing the number of main line derailment events reported over the most recent 10 years. Figure 4 also shows the breakdown by causal factors. Consistently over this period, roughly 70% of main line derailments have been caused by Track Factors and Equipment Factors, which is a change from the analysis of all derailments. Improvements to main line derailment safety are expected to be heavily weighted on improvements to track and equipment causes.
The years 1975 to 2010 were remarkable in terms of the challenges undertaken and answered by the global heavy-haul freight rail transportation industry and its research partners. Though a desire to further increase axle loads does not exist into the foreseeable future, many opportunities remain that offer potential to enhance the safety, efficiency and efficacy of rail transportation. Creative attention and time, and support for innovation, investment and implementation are essential as we look to future safety improvements, perhaps guided by the red markers in Figure 2—elimination of all main line derailments by 2030.
Toward this objective, the “Five-I” model is simple but very effective and has served the rail transportation industry well for many decades—Identify, Invest, Innovate, Implement and Improve.

Dr. Fry is the Vice President of Fry Technical Services, Inc. (https://www.frytechservices.com/). He has 30 years of experience in research and consulting on the fatigue and fracture behavior of structural metals and weldments. His research results have been incorporated into international codes of practice used in the design of structural components and systems including structural welds, railway and highway bridges, and high-rise commercial buildings in seismic risk zones. He has extensive experience performing in situ testing of railway bridges under live loading of trains, including high-speed passenger trains and heavy-axle-load freight trains. His research, publications, and consulting have advanced the state of the art in structural health monitoring and structural impairment detection.