Commentary
Happy New Year! STB Releases a New Rate Study
Written by Dr. William Huneke, Consulting Economist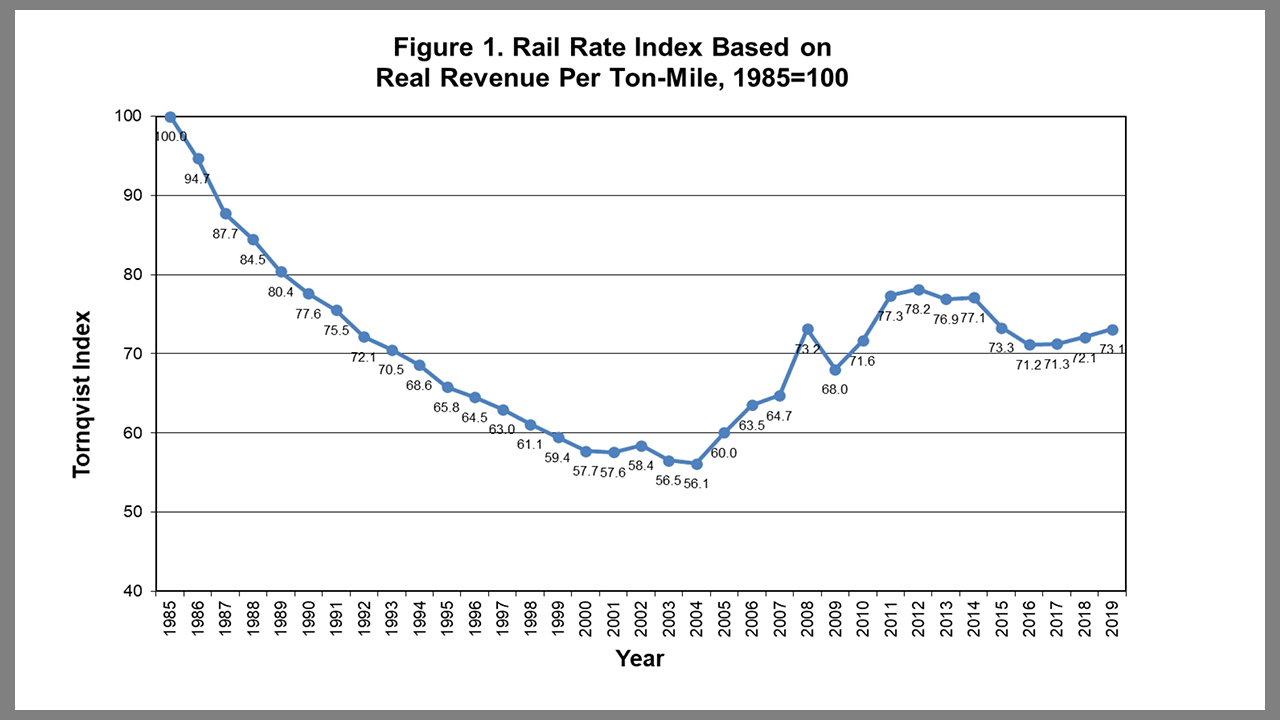
On Dec. 17, the Surface Transportation Board released a new rate study, which you may have missed in the holiday rush. I know I did. If you did and have an interest in railroad rate trends and data, I suggest you take a look:
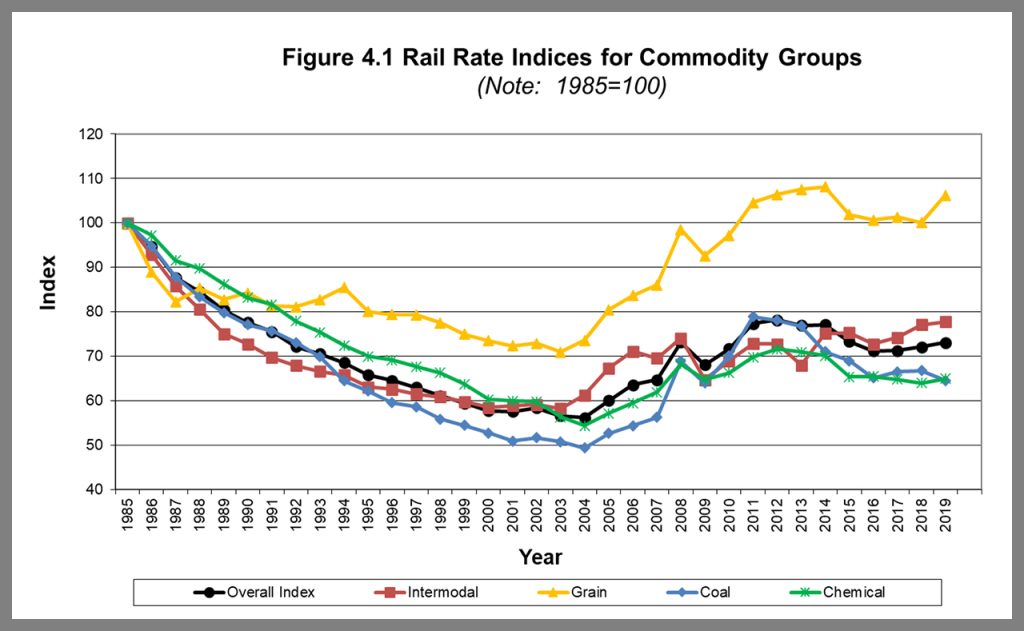
Let me provide my initial observations about what the data (all inflation adjusted numbers) show: From 2018 to 2019, rail rates rose 1.4%. Previous rate studies had shown that rates had declined for a couple decades until reversing in 2004-2005, but rates are now still lower than in 1985, 27% lower, adjusted for inflation. However, since 2004, rates have risen about 30%.
STB should study reasons for the upward rate trend since 2004. There is sure to be shipper pressure to investigate increasing rates.
I should also note that these data are based on Waybill revenue and have no associated costs. We cannot tell from the rate study whether higher rail rates mean increasing profit margins. Rates alone do not indicate increasing profits and perhaps increasing rail carrier market power.
Because higher rates might lead many to question if railroads have increasing profit margins and market power. STB should consider updating the Christensen study (A Study of Competition in the U.S. Freight Railroad Industry and Analysis of Proposals That Might Enhance Competition, Laurits R. Christensen Associates, Inc.):
The Christensen Study investigated rail margins and potential market power. That study is more than 12 years old. Christensen used econometrically derived estimates of marginal costs, an approach that should find more acceptance in the academic community, such as with the authors of the TRB report (Modernizing Freight Rail Regulation, Transportation Research Board, Special Report 318, 2015).
Another approach STB might take is improving the Uniform Rail Costing System (URCS). The agency should at least report what it has done or what is being done with URCS since it issued an URCS evaluation contract a couple years ago. (STB Moves to Rehab Antique URCS – Railway Age) A problem with URCS is that it was developed in the 1970s and ‘80s by STB predecessor Interstate Commerce Commission. Some URCS elements dating back decades.
The new STB rate study is the first since 2009, which covered the years 1985-2007. The new study covers the years 1985-2019, adds another 12 years. Many thanks to STB for the new study. Hopefully, it will release a new study every year, rather than every 12 years!
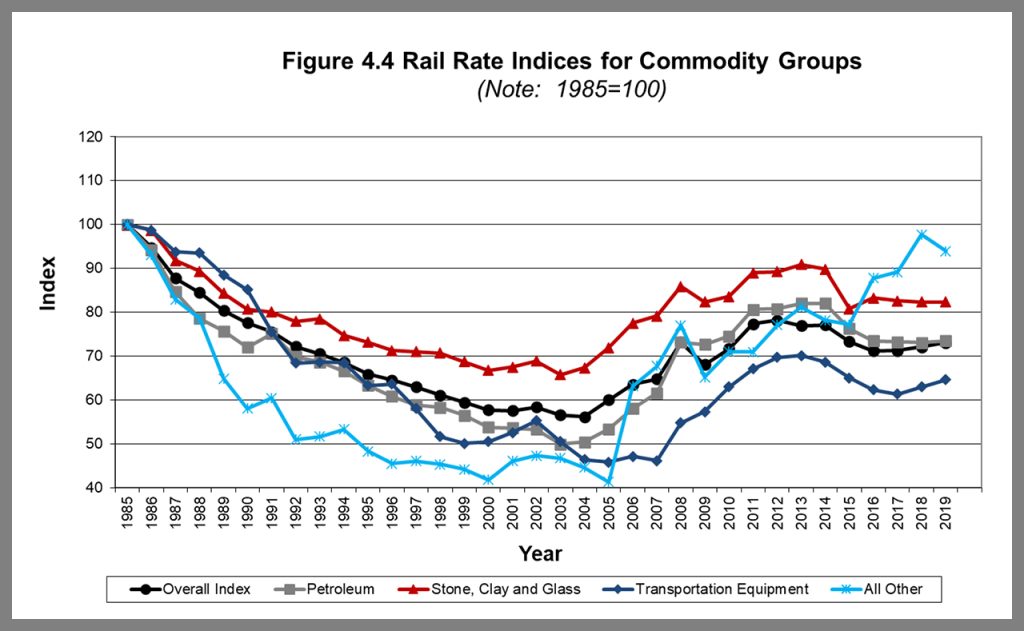
The study includes data for 14 commodities, usually at the 2-digit Standard Transportation Commodity Code (STCC) level. This allows STB to aggregate data to protect confidentiality.
Earlier versions of the study included commentary, which meant internal STB staff time and effort spent in revising. Perhaps it is just as well to do without the commentary if it increases the chances of more frequent releases.
Because STB also provides the underlying data in an Excel workbook. The Excel format allows the analyst to manipulate the data and save it or use it in other workbooks. This is a delightful New Year’s present for those of us who tend to be data geeks because we can dig through those spreadsheets to investigate and provide our own commentary:
Annual_Rail_Rate_Index_Study_2019.xlsx (live.com)
Looking at some major commodities they follow those two longer term trends: significantly down in the period starting in 1985 and then significantly up since 2004, except for grain, which is up 6% since 1985. Here’s some results for individual commodities:
STB develops its rate studies from the Carload Waybill Sample, which it processes annually. Railroads terminating 4,500 or more revenue carloads are required to sample their traffic and provide this sample as input to STB.
STB uses the GDP deflator and a Tornqvist adjustment in developing the rate study. The GDP deflator removes inflation. The Tornqvist looks at chages in traffic composition.
With any price index, a key question is always: does the collection of goods reflect what consumers are actually buying: what is in the “market basket?” If consumers are buying more chicken instead of beef than they were 20 years ago, that requires an adjustment to the market basket. STB uses the Tornqvist adjustment to remove effects of changes in the “market basket,” i.e., the composition of the traffic.
STB describes the Tornqvist adjustment in this way: “The Tornqvist index measures the change in prices within each category and assigns a percentage weight to each category based on its share of total revenues. The total index is essentially the weighted average of price changes within the various categories.” (2009 Rate Study, p. 3, Microsoft Word – 1985-2007 Railroad Rate Study.doc (stb.gov)
STB adjusts for changes in commodity mix, length of haul, shipment size and car ownership. These could be significant effects for rail services. For example, with coal’s declining share of the traffic mix, an index calculated without the Tornqvist adjustment would overstate the increase in rail rates.
Similarly, because rail rates for private cars are cheaper than rail cars, a shift to private cars might understate rail rates in an index calculated without a car ownership adjustment.
Here’s an example of how length of haul or shipment size changes might skew the numbers. I did a calculation for trends in revenue per ton-mile for grain shipment in private versus railroad cars from 1985-2019. Here’s what I calculated:
- Private cars: +4 %
- Railroad cars: –27%
But the STB study has grain rates rising 6%. What’s going on? I suspect that shipment distances are increasing, and longer hauls have lower rates per ton-mile or average shipment size has changed because the Tornqvist adjustment has kicked in and adjusted for shipment length or size or both.
I heartily thank STB for releasing this new study and hope will release a new study every year, this is valuable information for rail industry analysts and stakeholders. These data allow better comparisons to pricing trends inside the railroad industry and with other industries.

Dr. William Huneke is the former Director and Chief Economist at the Surface Transportation Board. He has more than 40 years’ experience in economics, transportation, railroad regulatory policy, management consulting, business analysis and teaching in the commercial and government sectors. He provides economic consulting on regulatory and arbitration matters. At the STB, Dr. Huneke led the Board’s analytical work and oversaw the collection of economic and financial data. Since leaving the STB, he has provided economic and litigation support to Class I railroads and other private-sector clients. He worked with the OECD (Organisation for Economic Co-operation and Development) to advise the Mexican government on its future rail regulatory policy. He represented the United States at an OECD conference on railroad industry structure. His private-sector experience included executive and management positions at UUNET, Freddie Mac and the Association of American Railroads. Dr. Huneke has taught graduate business courses at the University of Maryland, Robert H. Smith School of Business. He holds a doctorate from the University of Virginia and a B.A. from Swarthmore College.