Tough Love, Because Competition Beckons
Written by Jim Blaze, Contributing Editor
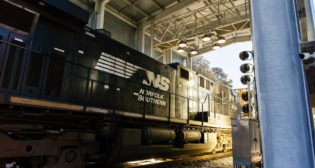
Nevada, March 1, 2020. There are way too many empty cars in the TTX fleet. Jim Blaze photo.
On May 12, IANA (Intermodal Association of North America) offered an interesting look at the North American rail intermodal sector. The webinar featured technical slides shared by Bloomberg Senior Analyst Transportation & Logistics Lee Klaskow and TTX Vice President Fleet Management Company Pat Casey. TTX market development experts John Woodcock and Peter Wolff also participated.
In this webinar, the first emphasis was on what is now driving intermodal, and why might those forces be different than what we observed in 2019 and early in 2020? The second theme was, where do we go from here in mid-May? Here is 1Q2020 TTX intermodal volume, by major geographic lanes:

The data is accurate. No question about that. But as a mid-May report card, it is not truly relevant as a predictor. Why not? Because we already know that traffic volume is trending down overall across the U.S. at about 14%. In some corridors, we have reports from third parties that certain lanes are down much more.
Lee Klaskow pointed that out as he described the competition from trucking and the changes in spot pricing competition that affects both TL (truckload) and spot intermodal dynamics.
As a historical record, this table identifies the lanes that have seen the biggest intermodal volume declines during the period ending March 31 this year, relative to the prior-year period:

There is some good insight courtesy of TTX and IANA, such as this graphic that examines the tariff impacts:

There were some predictions of broad volume shifts out toward the end of 2020, like this graph of West Coast vs. East Coast probable shifts:

Here is the summary IANA presentation outlook broken down into TTX and Piers data volume changes. It projects the possible volume differences for the U.S., Canadian and Mexican intermodal markets, plus the overall North American total:

As to the where do we go from here, that remains somewhat of an open question. Neither the presenters nor the folks engaged in the Q&A session were able to directly address mid-May to end-of-June volume flows against the recent weekly evidence. That is a missed intelligence opportunity, and it is not unique to these rail colleagues.
There is within the railroad industry an absence of near-real-time rail sector data. This is troubling because rail (specifically rail intermodal) competes with trucks. In contrast, there are a great deal of near-real-time trucking and highway transport information and traffic volume and pricing flow metrics.
Over the past decade, there has been a surge of greater traffic detail and timeliness of reporting from third-party information providers and media by experts at FTA to DOT, as well as from companies like FreightWaves. Increasingly, the trucking-competitive volume and even pricing data are visible at the selected regional market O/D corridor level. Yet, rail and rail intermodal are largely “missing.”
Now, one-third of the way through 2020, the challenge for rail intermodal is to become more time relevant in its reporting. Its tough to compete, let alone forecast when the algorithms and graphs are “as of” a month and a half-ago closing date.
This is a widely known information gap in North America’s railroad digital presentations—widely known by customers, particularly, the demand side drivers of intermodal found at the receiver (destination) end. Yes, it’s the buyers at the delivery end that really are the demand site focus. They are watching. What are we railroaders telling them?
It is not just an issue for IANA, whose data sets as accounting records are excellent. Yet, the data is not up to par at being predictive, with about a month and a half lag.
In contrast, let’s consider the maritime sector as to near-real-time data. There are data access providers that are right now probing the ship positioning GPS and cargo manifest reports to forecast this current container cargo unloading by strategic location. They can do this while the ship is still at sea.
The maritime disruptive digital intel movement providers have names like eeSea, Sea-Intelligence and CargoMetrics. Among the investors backing some of them are the former CEO and executive chairman of Google, Renaissance Technologies, and an Israeli shipping magnate. How good is the reporting? In the words of some customers, “The fidelity of their cargo reporting is setting new standards.”
That’s the railroad industry challenge, and not just for TTX. The challenge to improve is for all of the rail freight sector providers. Why is this so difficult for trains moving intermodal containers?

Yes, TTX does a great job organizationally, as described in a recent FreightWaves commentary: “TTX pool railcars increase intermodal efficiency. TTX is intermodal rail’s silent partner.”
Behind the scenes, there are signs that both TTX and IANA realize that competition will force change. True, there may be underlying problems related to “who owns” the intermodal near-real-time movement data. It might not be TTX-solvable without cooperation and negotiation.
Today, smaller shippers and smaller 3PL (third-party logistics) organizers are probably the most disadvantaged by the reporting lag. From previous research and other sources, companies the size of JB Hunt or HUB Group likely have the intel they need because of their coverage and overall intermodal volume size. They have a predictor algorithm down to the O/D pair definition. With internal spreadsheets that have a robust six weeks or more of a second-quarter baseline, players like these can create near-real-time predictability.

Do the Federal Railroad Administration and STB see this same trending detail? There is no evidence that they do. They are not keeping up with real time volumes, pricing, bottlenecks and related intermodal geography if they have to rely upon the Census of Transportation and outdated waybill samples.
If the rail industry is to pivot toward growth, and increase its truck vs. intermodal market share, rail data has to be timelier. To build customer confidence, pattern timeliness and transparency are going to be critical. Call this “tough love because competition beckons.”
Here’s my intel metrics view:

Who will first change the intermodal rail reporting so that we do know “where we go from here”? When could this happen. My money is actually on TTX and its IANA partnership. What’s your opinion?
(For additional information, contact IANA Director of Education Hal Pollard, 301-982-3400, ext. 356.

Independent railway economist, Railway Age Contributing Editor and FreightWaves author Jim Blaze has been in the railroad industry for more than 40 years. Trained in logistics, he served seven years with the Illinois DOT as a Chicago long-range freight planner and almost two years with the USRA technical staff in Washington, D.C. Jim then spent 21 years with Conrail in cross-functional strategic roles from branch line economics to mergers, IT, logistics, and corporate change. He followed this with 20 years of international consulting at rail engineering firm Zeta-Tech Associated. Jim is a Magna cum Laude Graduate of St Anselm’s College with a master’s degree from the University of Chicago. Married with six children, he lives outside of Philadelphia. “This column reflects my continued passion for the future of railroading as a competitive industry,” says Jim. “Only by occasionally challenging our institutions can we probe for better quality and performance. My opinions are my own, independent of Railway Age and FreightWaves. As always, contrary business opinions are welcome.”
FreightWaves SONAR offers the most essential rail and intermodal data available, with daily updates on rail and intermodal pricing and volumes. Additionally, compare rail market trends against other modes of transportation gain a comprehensive view of logistics markets. Users can react faster than ever to changing market conditions, giving them an advantage never before seen in freight. To learn more and schedule your personal free trial, click here.
