Deep Dive
Written by Dr. Allan M. Zarembski
Figure 2: Brake Failure Predictive Model.
Using data science to better understand and maintain rolling stock performance.
RAILWAY AGE, FEBRUARY 2021 ISSUE: Data analytics, often referred to as “Big Data” has become an important part of the railroad industry’s efforts to improve performance, increase safety and reduce costs. This effort extends to both freight and passenger rail, and cuts across traditional departmental lines, with applications in engineering (track and structures), equipment (rolling stock) and transportation (operations) [1, 2]. The University of Delaware’s annual “Big Data in Railroad Maintenance Planning” conference provides a forum for railroad and data analytic professionals to come together with academia and discuss the latest applications and research in railway-related data science. December 2020’s “virtual” conference, which attracted more than 270 registrants from three continents, examined both rolling stock- and track-related Big Data applications. This article will discuss the rolling stock side; next month’s article will address track- and infrastructure-related applications.
The growing value of Big Data analytics was addressed by the conference keynote speaker, William C. Vantuono, Editor-in-Chief of Railway Age, and was highlighted in a quote he presented from an earlier address by Ron Batory, former FRA Administrator, who said, “Proper application of artificial intelligence (AI) can create less operational risk and afford a safer environment. Continuous strengthening of the predictive algorithms associated with AI can deliver endless value toward eliminating variability, thus creating more productive capacity. Smarter railroading in the years ahead can be achieved by advancing use of AI technology.”
This was clearly seen in the conference, where the leadoff speaker stated that while “traditional” data analysis can give you answers to existing questions, Big Data analysis techniques, including machine learning (ML) and AI, will give new and unexpected insights and help the railways move from descriptive and diagnostic use of data to the most insightful predictive and prescriptive applications that were the focus of the conference [3]. In fact, ML is broadly understood to be “a group of methods that analyze data and make useful discoveries and inferences from that data” [4].
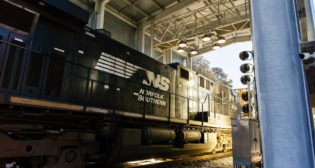
The first technical presentation of the conference showed the value and effectiveness of the new generation data science/AI units that have been created on several Class I railroads. The presentation, “AI and Predictive Analytics in Production to Prevent Locomotive Failure using High-Velocity Real-Time Sensor Streams” [5], looked at the use of locomotive sensor data, including cooling water pressure and oil temperature, to predict locomotive shutdown due to insufficient cooling water. The presentation showed how data analytics could be used on a large data set, as illustrated in Figure 1, to develop predictive algorithms to allow for the scheduling of maintenance prior to a shutdown event in the field. Using such unsupervised learning data analytic tools as Naïve clustering, K-means clustering, DBSCAN and Spectral clustering, the railroad’s DS/AI team was able to develop a predictive model that used the monitored locomotive oil temperature and water pressure data to predict loss of cooling water events and associated engine shutdown, on average seven days in advance of the event. In addition, the algorithm was found to have very low false-positive predictions, with initial applications reaching 95% to 99% precision levels.

Another presentation indicated that failure prediction models have similarly been developed for brakes, as shown in Figure 2 (top image), and for wheel bearings (Figure 2A). [6].

Application of data science to vehicle and train performance is not just limited to failure prediction. A presentation by Virginia Tech looked at the wheel/rail interface and applied Big Data analysis techniques to test data to allow for the modeling of this behavior and the identification of key parameters that effect traction [7]. Using extensive data from their quarter-scale wheel roller rig, the researchers were able to collect traction data for a broad range of conditions to include vertical load, angle of attack (AOA), lateral displacement and cant angle. Applying a range of analysis techniques to include single- and multiple-parameter regression models, principal component analysis and Support Vector Regression Models, the researchers were able to develop relationships that allow for the prediction of such key performance parameters as lateral wheel/rail force, as shown in Figure 3. Using these data analytic tools, it was possible to address wheel/rail contact modeling from an entirely new perspective; i.e., developing a convenient means for predicting traction forces based on test data.

Another application of data analytics and associated ML techniques presented at the conference was to root-cause analysis failure analysis; specifically, using onboard and/or wayside data for root-cause analysis and fault prevention [8]. The specific application case discussed was root-cause analysis of processor reset events, such as occurs on onboard processors and systems on a range of rolling stock. Both the generalized root-cause analysis and the specific processor reset analysis employ combined data science/ML approaches for retrieving correlation information from various sources, such as equipment log files, maintenance reports and their supporting documentation. The approach is a data-driven, AI-first approach that includes:
• Exploratory data analysis.
• Statistical approach.
• Time-series methods.
• Natural language processing/N-grams.
• Network science/complex networks.
Thus, for example, the Natural language processing element, uses N-grams for text-based data analysis, as shown in Figure 4.

The associated root-cause analysis toolkit includes both deterministic and probabilistic models, with:
• Fault trees, first-order logic.
• Decision trees, SVM classifiers.
• Bayesian networks, fuzzy logic.
• Stochastic approaches, St-Petri Nets.
As has been seen in this and previous Big Data conferences, there is growing use of data analytics for addressing transportation and rolling stock issues to include:
• On-time performance.
• Conflicts (merging/diverging routes; meets/passes).
• Rolling stock (equipment) maintenance and failures.
• Locomotive maintenance and failures.
• Train handling.
• Positive Train Control (PTC).
• Prediction of anomalous events.
The same pattern can also be observed in the maintenance of way/infrastructure side of the railway organization, as will be discussed in next month’s issue.
That this arena of data analytics/ML/AI continues to grow and find expanded applications in the rail and transit industry can clearly be seen over the past seven years of the University of Delaware’s Big Data in Railroad Maintenance Conference presentations. And the expectation is that it will continue to grow in importance. The next Big Data conference is scheduled for Dec. 15-16, 2021. For further information, contact Professor Allan M. Zarembski at [email protected].
References:
1. Zarembski, A. M., “Better Railroading Through Big Data,” Railway Age, May 2018.
2. Zarembski, A. M., “Big Data Journey: From Collection to Analysis to Predictive Use,” Railway Age, March 2020.
3. Zarembski, A. M., Introduction, 2020 Big Data in Railroad Maintenance Planning Conference.
4. Attoh-Okine, N., “Big Data and Differential Privacy: Analysis Strategies for Railway Track,” Wiley, May 2017.
5. Amouie, M., Chief Data Scientist, Norfolk Southern, “AI and Predictive Analytics in Production to Prevent Locomotive Failure using High-Velocity Real-Time Sensor Streams,” 2020 Big Data in Railroad Maintenance Planning Conference.
6. Thompson, T., “Uptake Visual Presentation,” 2020 Big Data in Railroad Maintenance Planning Conference.
7. Hosseini, S. M.; Ahangarnejad, A. H.; Radmehr, A.; Ahmadian, M., Virginia Tech, “A Statistical Approach to Modeling Rail-Wheel Traction using Big Data,” 2020 Big Data in Railroad Maintenance Planning Conference.
8. Barcelos, E., Data Science Innovation Lead, Alstom, “Tracing event correlation networks from wayside and onboard log data for root-cause analysis and fault prevention with a Complex Networks and Machine Learning approach,” 2020 Big Data in Railroad Maintenance Planning Conference.