Timeout for Tech: Correlation vs. Causation
Written by Gary T. Fry, Vice President, Fry Technical Services, Inc.; Railway Age Contributing Editor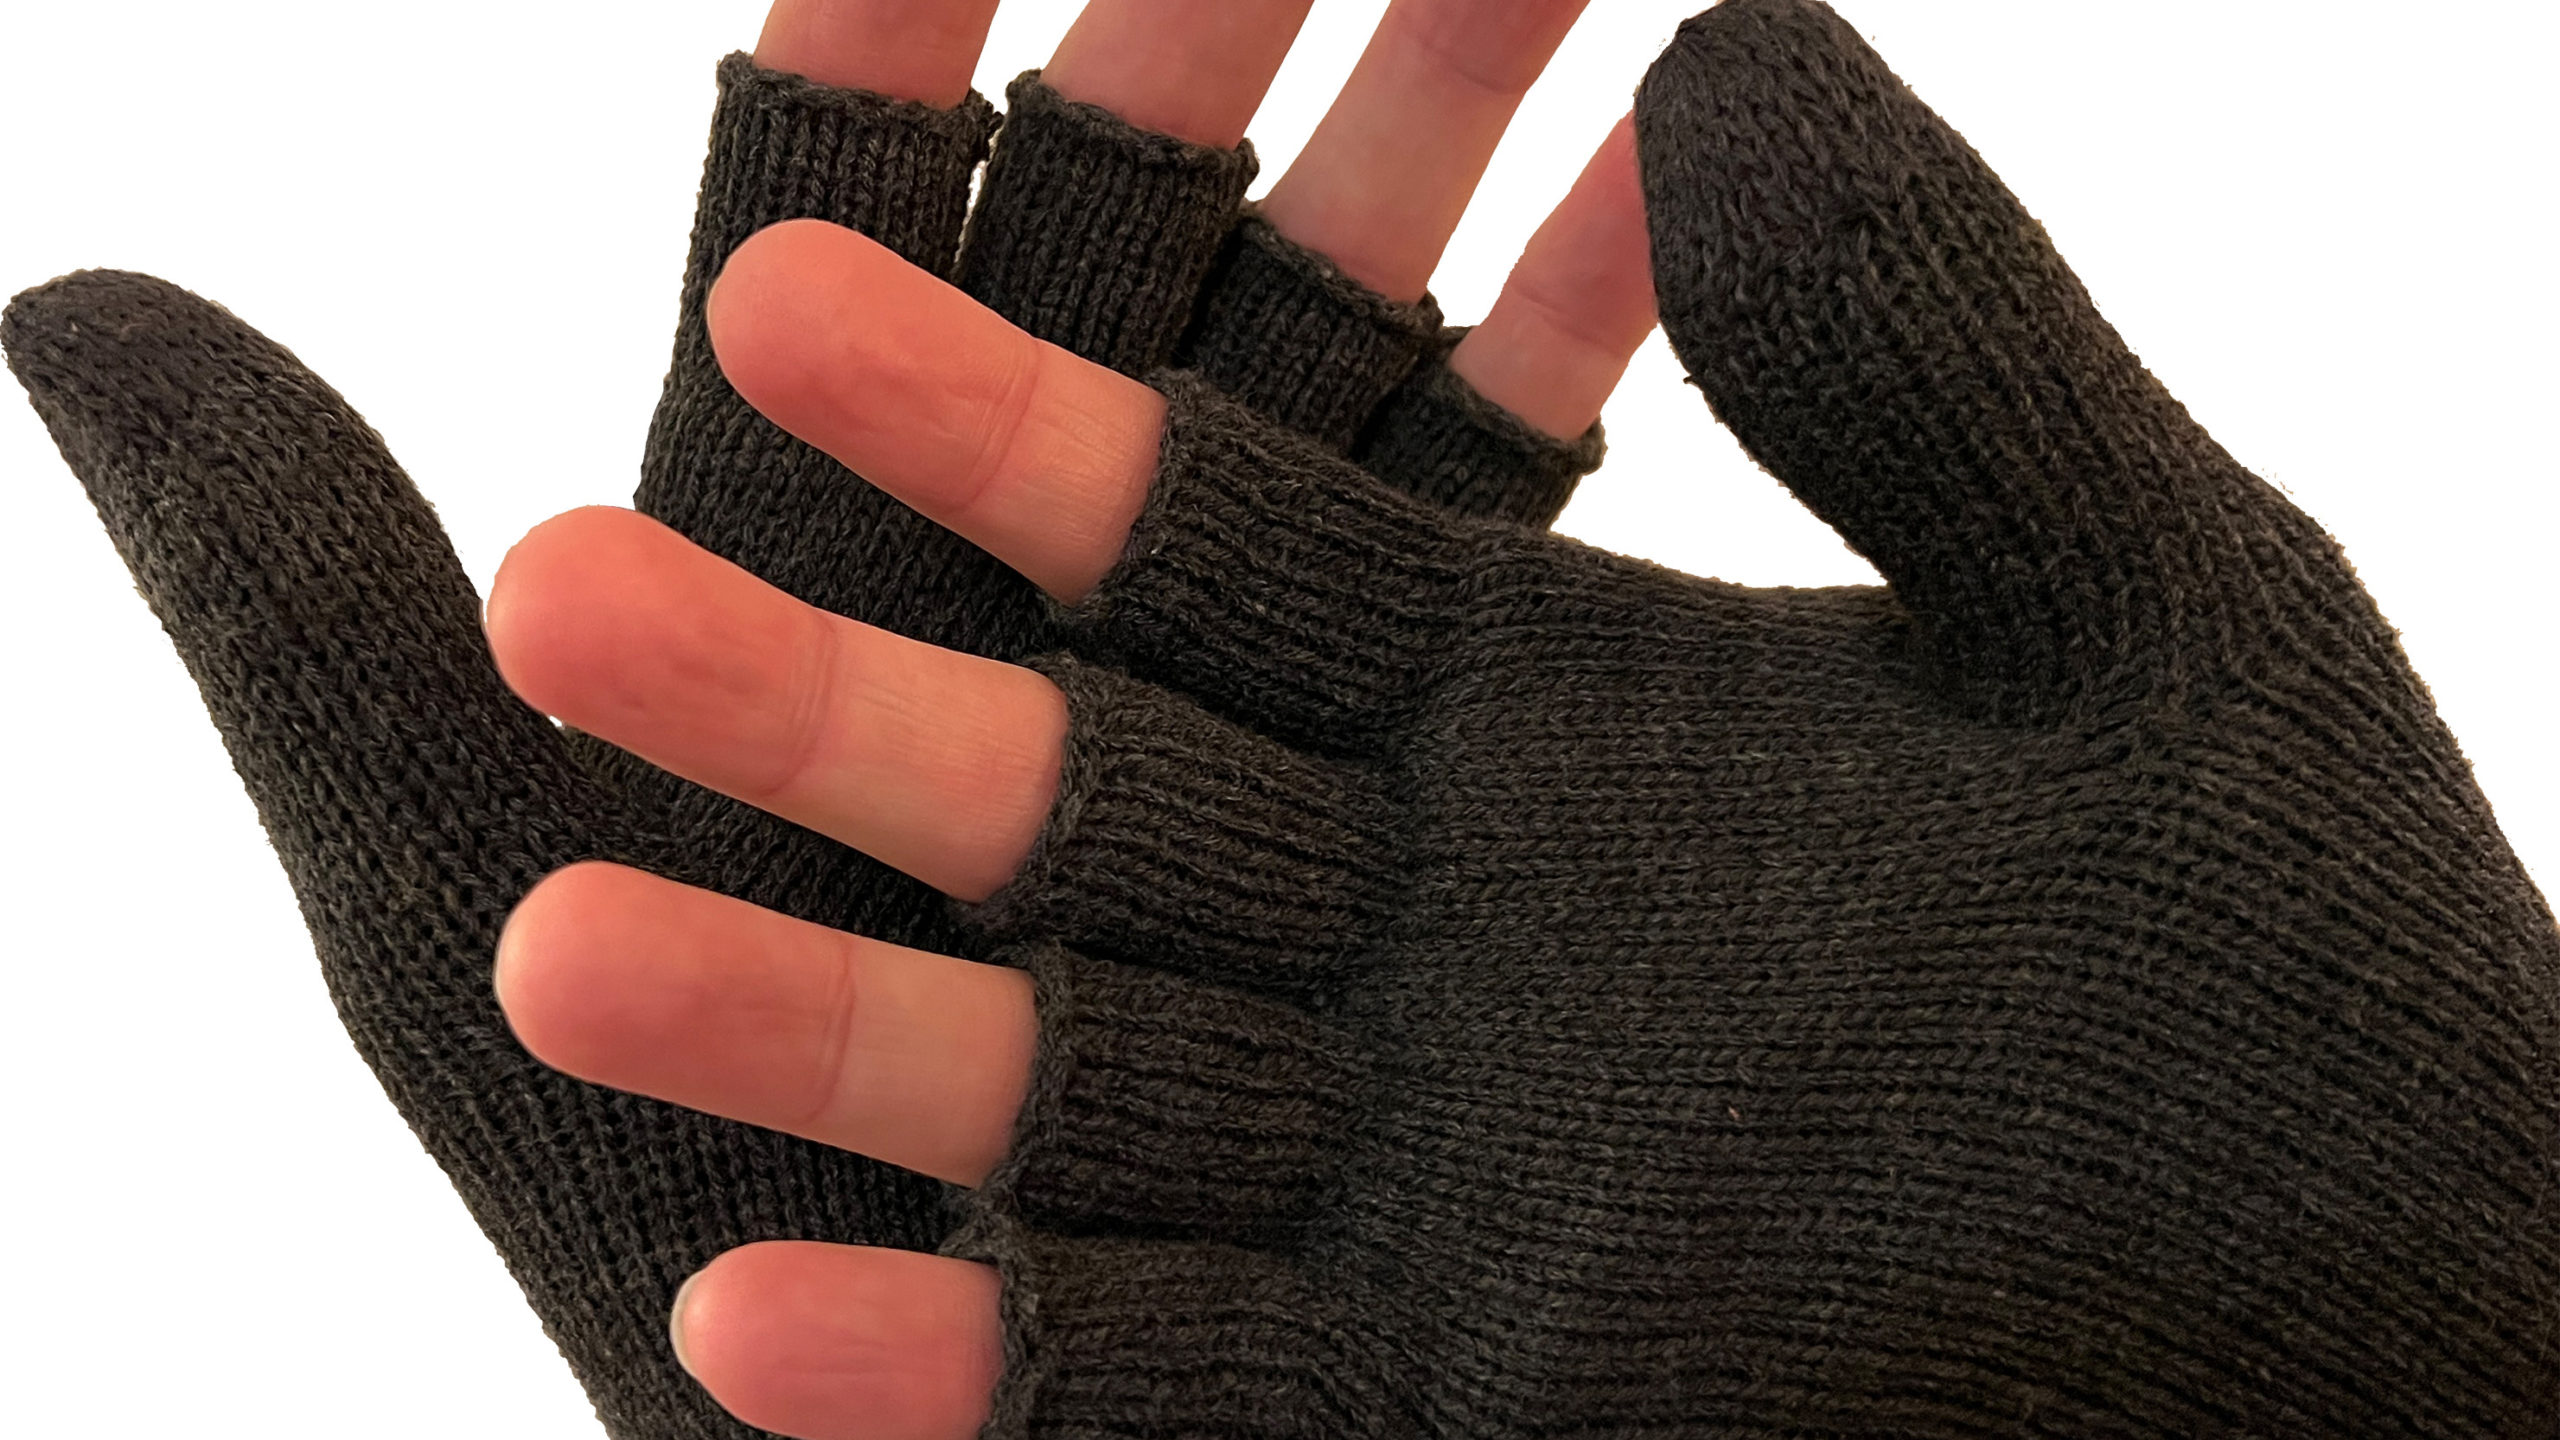
Figure 1. Correlation does not imply causation. Sales of fingerless gloves and cases of frostbitten fingers both increase in winter months. But fingerless gloves are not a cause of frostbite. (Courtesy of Gary T. Fry.)
RAILWAY AGE JANUARY 2023 ISSUE: Welcome to “Timeout for Tech with Gary T. Fry, Ph.D., P.E.” Each month, we examine a technology topic that professionals in the railway industry have asked to learn more about. This month, we focus on the issue of correlation vs. causation and how to avoid a common pitfall—mistaking effects as causes.
Every day we are inundated with a record volume of information arriving at unprecedented speed from every corner of the world. In technical settings, data sets have never been so easy to generate, transmit and process. Volume, speed and convenience, however, are not guarantees that the information we receive is immediately or even reliably useful. Basic understanding of relevant facts and logic is necessary before committing to “data-driven” decisions and actions. In technical discussions of data, the most common confounding issue I encounter involves the “hidden link” problem. Let’s consider a simple, intuitive case.
Figure 1 is a photograph of fingerless gloves (see above). During winter months, sales of fingerless gloves increase. Also, during winter months, cases of frostbitten fingers increase. I should reasonably expect a strong correlation between sales of fingerless gloves and cases of frostbite. But correlation, no matter how strong, does not imply cause-effect relationships. Fingerless gloves do not cause frostbite. For example, I can safely wear fingerless gloves on a warm summer day with negligible risk of getting frostbite. Frostbite has only one cause—exposure of skin to temperatures at which skin cells can freeze. In this case, the cold of winter is the obvious “link” that causes a strong correlation between two otherwise unrelated events—namely sales of fingerless gloves and frostbitten fingers.
Sometimes correlative links exist that are not as obvious as winter in our example. In such cases, data sets that present correlations between events tempt us to infer cause-effect relationships that simply do not exist. There are two notable examples that I have encountered repeatedly over the years. The first is the false assumption of a causal relationship between railhead wear and occurrences of broken rails.
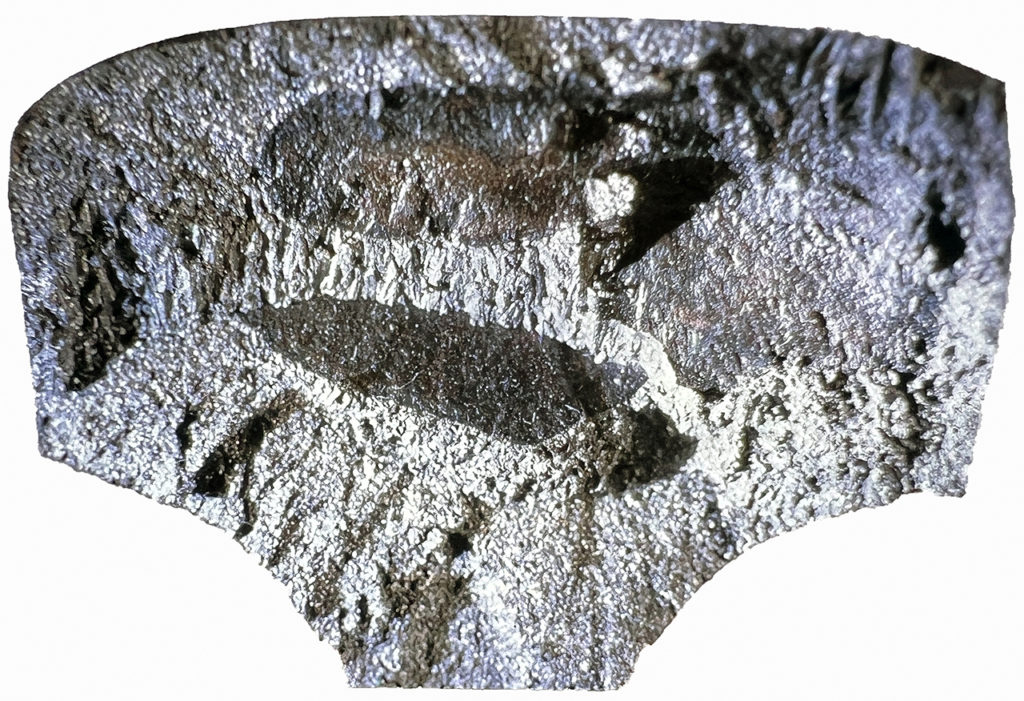
Figure 2. Macrophoto of a fatigue defect in the head of a railroad rail. (Courtesy of Gary T. Fry.)
Almost uniquely, a broken rail in service is caused by the final, unstable growth of an undetected fatigue defect that has reached a critical size (Fry 2022b). Worn rail that does not contain fatigue defects is unlikely to ever fracture under normal service conditions. For example, over the past 30 years, I have not observed a rail fracture in normal service that did not originate from a fatigue defect. Fatigue defects, such as seen in Figure 2 (above), are caused by atomic-scale imperfections called dislocations that are present in all steel objects. These imperfections are mobilized by stresses within the rail that are caused by loaded wheels rolling on the rails. After millions of passages of loaded wheels, the imperfections can become aligned and develop into what we term stage-one fatigue cracks, which then form fatigue defects that can cause rails to break.
Now let’s consider railhead wear, the cumulative loss of steel from the surfaces of a railhead caused by abrasion from passing wheels and by rail grinding operations. Railhead wear does not cause fatigue defects and therefore does not cause broken rails. In fact, when wear rates are high enough—through wheel abrasion, rail grinding, or in combination—railhead wear can actually prevent the formation of railhead fatigue defects.
With that introduction, we see that fatigue defects in rails and railhead wear are both caused by loaded wheels rolling over the rails. As a result of that common link, there can be a correlation between railhead wear and fatigue defects in rail. Consequently, since fatigue defects in rails cause broken rails, there can even be a correlation between railhead wear and broken rail, but it’s certainly not a causal relationship. And this correlation is a complex one, because where railhead wear rates are highest, the likelihood of railhead fatigue defects forming is substantially diminished. The main takeaways are these: Fatigue defects in rail cause broken rail. Railhead wear does not cause broken rail, nor does it cause fatigue defects in rail.
It is the presence of fatigue defects in rails and wheels that is essentially causal to their fracture.
The second notable example I encounter is more subtle and complex. It is the false assumption that cold winter temperatures cause broken rails and broken wheels. As in the previous example, it is the presence of fatigue defects in rails and wheels that is essentially causal to their fracture. In the absence of the fatigue defects, it is unlikely that rails or wheels would ever break in normal service, even at extremely cold temperatures. As with broken rails, I have not observed a wheel rim that has fractured in service that does not originate from a fatigue defect—usually an internal one. Because rails and wheels without fatigue defects are unlikely to fail at any time of year, the problem is to understand why rails and wheels with fatigue defects fail more often in the winter than in the summer.
To address this problem, we need to understand steel material behavior. Most metals, including steel, have a material property called “fracture toughness.” Fracture toughness is a measure of the ability of the metal to sustain load, without fracturing, in the presence of planar defects, such as fatigue defects. Under a given load, the larger the value of fracture toughness, the larger a fatigue defect can be before causing the steel to fracture.
There are a few of things to note about fracture toughness. In the absence of a planar defect, fracture toughness effectively has no meaning. Fracture toughness does not have much influence on the formation of fatigue defects or on their growth rate. It simply correlates with the size that a fatigue defect can become, under a given load, before causing a sudden fracture—the defect’s so-called critical size in that material. From a practical point of view, we generally specify a minimum fracture toughness to ensure that a defect’s critical size is much larger than its reliably detectable size. That way we can remove defective components before they fail in service. Of course, if the components are not inspected for fatigue defects, then the risk of service failure is not mitigated. In North America, for example, freight railcar wheels in revenue service are not routinely inspected for internal fatigue defects.
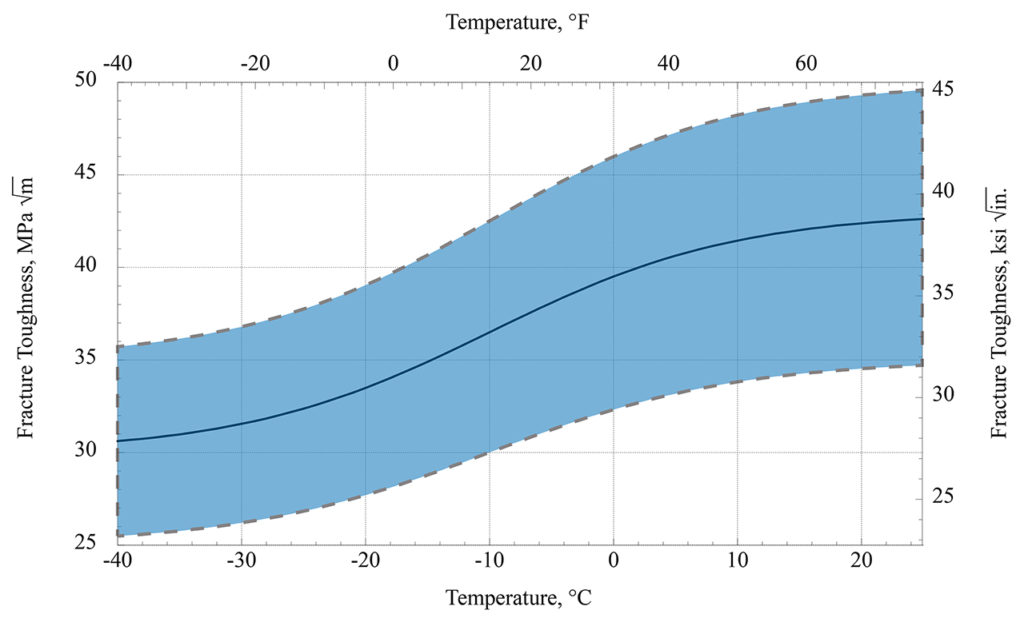
Figure 3. Plot of representative fracture toughness value ranges versus temperature for common pearlitic railway steels used in rails and wheels. (Courtesy of Gary T. Fry).
Figure 3 (above) is a plot of fracture toughness vs. temperature for pearlitic steels used in railroad rail and railcar wheels. It is apparent that fracture toughness displays appreciable variability in wheels and rails. It is also apparent that fracture toughness in wheels and rails is much smaller on cold winter days than on warm summer days. Stated another way, a fatigue defect that is tolerated by a wheel or rail in the summer, might cause a fracture on a cold winter day.
Referring again to Figure 3, one might reasonably expect to see clusters of rail and wheel fractures with the arrivals of the coldest days of winter. The fractures are triggered by undetected fatigue defects that survived the coldest days of the previous winter, though perhaps barely so. These defects continued to grow but managed to remain a subcritical size, and undetected, through the warmer spring, summer, and fall days but are now critical in the new winter’s cold under the steel’s lowered fracture toughness. If the defects had been that size the previous winter, they would likely have triggered fractures then.
In summary, before taking decisive action based on the apparent implications of data, it is important to consider the issues of correlation and causation. When two or more events have a common cause, they may be very strongly correlated without having cause-effect relationships between or among one another. Watch out for those hidden links.

Dr. Fry is Vice President of Fry Technical Services, Inc. He has 30 years of experience in research and consulting on the fatigue and fracture behavior of structural metals and weldments. His research results have been incorporated into international codes of practice used in the design of structural components and systems, including structural welds, railway and highway bridges, and high-rise commercial buildings in seismic risk zones. He has extensive experience performing in situ testing of railway bridges under live loading of trains, including high-speed passenger trains and heavy-axle-load freight trains. His research, publications and consulting have advanced the state of the art in structural health monitoring and structural impairment detection.