Timeout for Tech: Automated Inspection Opportunities & Limitations
Written by Gary T. Fry, Vice President, Fry Technical Services, Inc.; Railway Age Contributing Editor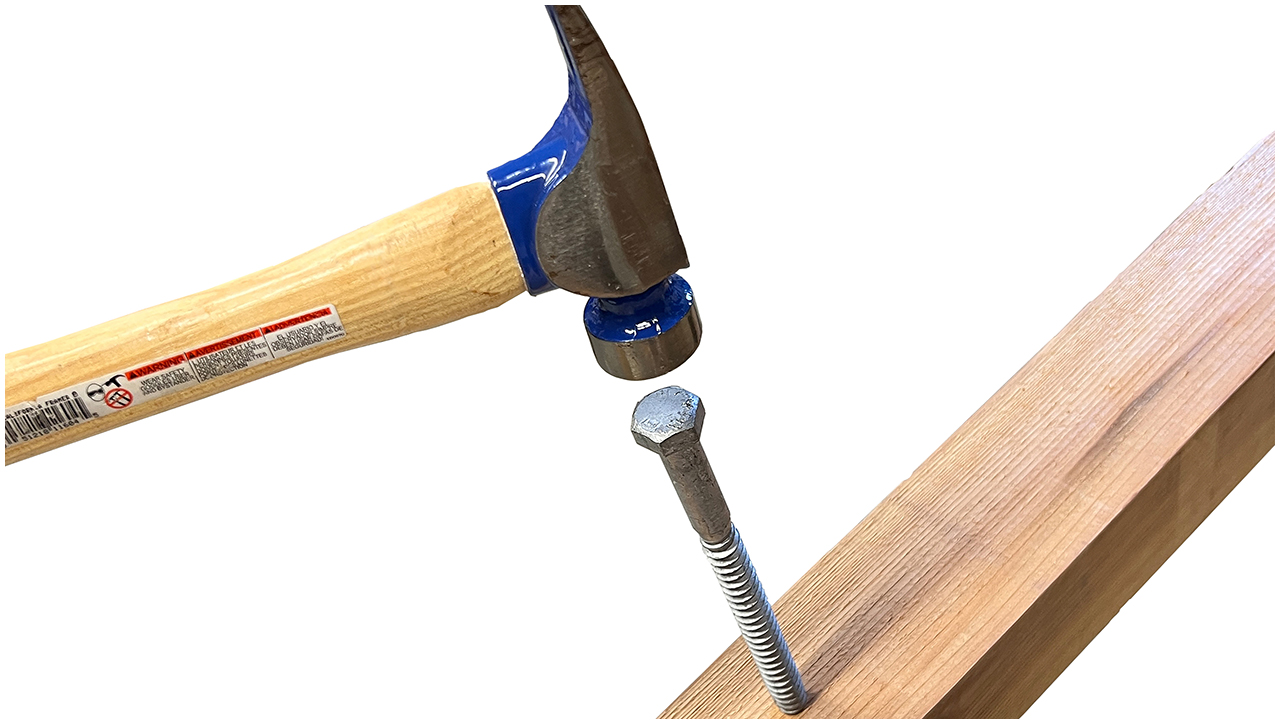
Figure 1: When the only tool in your toolbox is a hammer, every problem looks like a nail. New strategies to address old problems require a continually updated inventory of innovative and effective tools. (Courtesy of Gary T. Fry.)
RAILWAY AGE, FEBRUARY 2023 ISSUE: At the end of the day, “What gets measured gets managed.”
Welcome to “Timeout for Tech with Gary T. Fry, Ph.D., P.E.” Each month, we examine a technology topic about which professionals in the railway industry have asked to learn more. This month, our topic is automated inspection technologies.
“When the only tool in your toolbox is a hammer, every problem looks like a nail.” “Use the right tool for the job.” “Work smarter—not harder.” Maxims like these are often inspired by makeshift efforts such as depicted in Figure 1 (above)—attempting to drive a lag screw using a hammer. There is clearly room for improvement there. But we can rest assured that even when a situation seems to offer very little room for improvement, we have a maxim to guide us: “If it ain’t broke, don’t fix it.”
These pithy gems tell us to be open-minded and innovative but not impulsive. It can be challenging and resource intensive to strike the right balance between constancy and change. Of course, when everything works out, substantial and lasting gains can be attained. With this in mind, let’s look at some examples of strategic innovation related to inspecting engineered systems in the railway industry.
Especially over the past 30 years, many railway companies have taken up the challenge of improving their methods for inspecting track and rolling stock. As with most other industries, efforts have generally focused on automated sensing and measurement systems, and there are quite a few success stories. For example, on the track side we have:
- Multiple implementations of on-train track geometry measurement systems.
- Multiple implementations of on-train rail profile measurement systems.
- Rail defect detection systems, including ultrasonic systems (for subsurface cracks) and electromagnetic field imaging systems (for surface cracks and spalls).
- Tie inspection systems.
- Ballast inspection systems, including optical, light detection and ranging (LIDAR) and ground penetrating radar (GPR).
There are also several wayside systems available to monitor passing rolling stock:
- Truck performance detectors.
- Acoustic bearing detectors.
- Thermal bearing detectors.
- Thermal wheel detectors.
- Wheel impact load detectors.
- Wheel profile measurement systems.
- Automated cracked/broken wheel detectors, including ultrasonic (for subsurface fatigue cracks), electromagnetic field imaging (for surface cracks and spalls) and optical (for partially failed rims).
The cutting-edge and evolving technology included in these systems helps us make assessments of system condition with unprecedented accuracy, precision and repeatability, but there are four features that really stand out.
- Results from automated assessments are often transmittable in near real-time.
- Automated assessment results are natively digital and can be transmitted directly to centralized data lakes for immediate enterprise-wide use in their data analytics applications.
- With on-train systems and distributed wayside systems, frequent repeated assessments of the same components facilitate seamless condition trending initiatives.
- Most important, automated assessments can be performed on components while they are operating and under load, giving critical insight to component condition and suitability for continued safe use.
Unarguably, these have become essential tools for the modern railway, and the future will see more implementation of automated approaches. But no system is ever perfectly capable of providing “correct” assessments; all have limitations.
Some basic statistical considerations are at play that must be quantified and monitored to ensure a system’s suitability for use in a safety-critical application. First and foremost are the statistics related to system performance—for example, with detection systems, true positives, true negatives, false positives and false negatives. And it’s not just the percentage of times a system gets it “right” or “wrong” that is important. Rather, it’s the statistical nature of the “wrongs” that must be quantified and understood. Let’s look at this more closely.
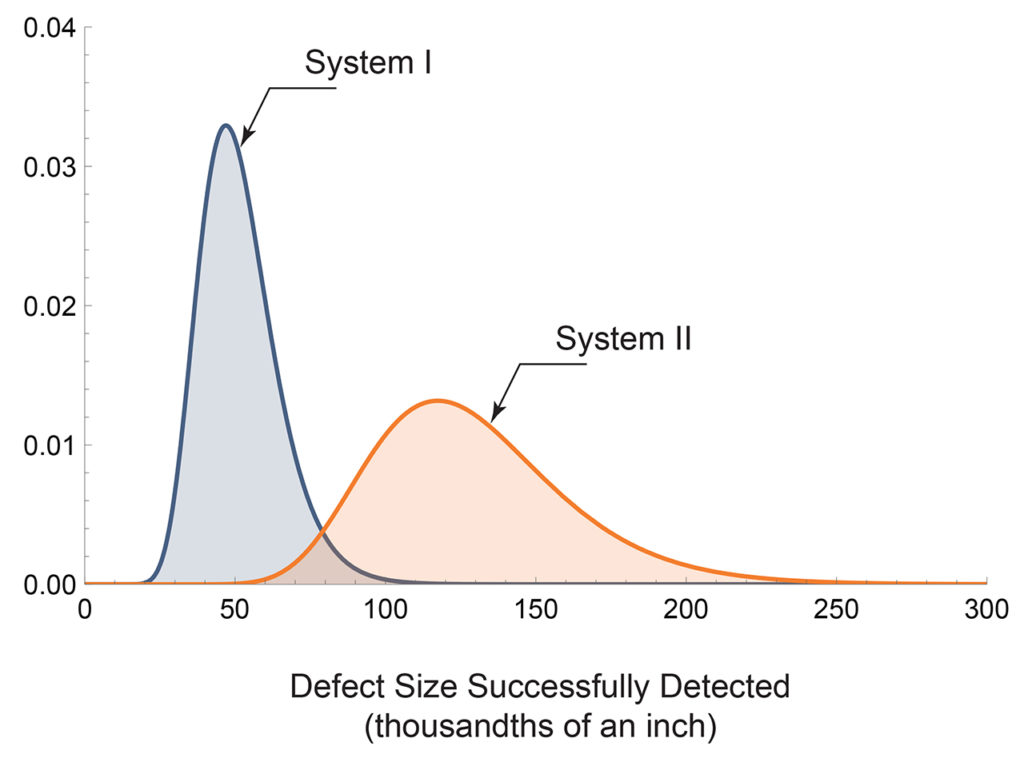
Figure 2: Probability distribution functions for defects successfully detected by two different inspection systems. (Courtesy of Gary T. Fry.)
Figure 2 (above) shows probability distributions for the size of defects that are detected by two different systems. System I appears more capable of detecting smaller defects than System II. This is good to know, but what was missed? Figure 3 (below) shows probability distributions for the size of defects that are left undetected by the same two systems. With this view of the statistics, we see that System I is likely to leave undetected much larger size defects than System II.
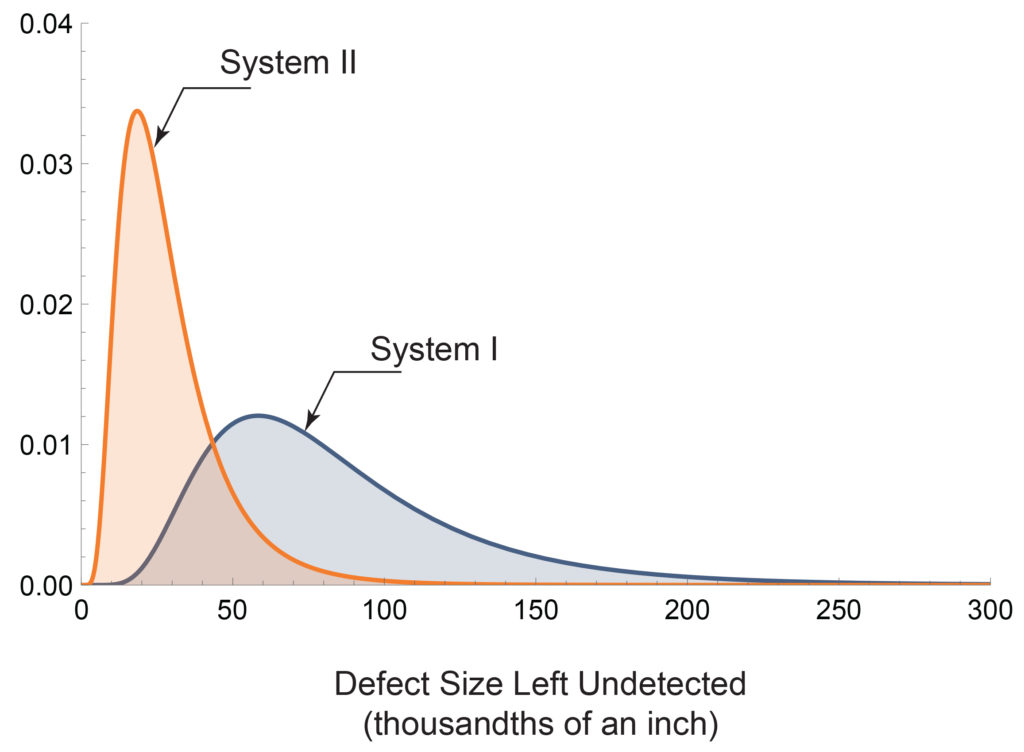
Figure 3: Probability distribution functions for defects left undetected by two different inspection systems. (Courtesy of Gary T. Fry.)
So, which system is the better choice to use? The answer is System II. It is much less likely than System I to miss the big stuff! To reach that conclusion, however, we need to have data such as illustrated in Figure 3. We also need the data from Figure 3 to estimate the risk of failure of the components that have been freshly inspected. This is because it is the defects that we miss that cause failures—not the defects that we find and remove. It’s nice to know what various inspection systems can find, but it’s essential to know what they miss!
I am often asked about the quality differences between automated inspections and manual inspections and how to assess when manual processes should be replaced by automated technology. In part, my answer depends on the objectives. For example, in a railway environment, it is often more difficult, less reliable and needlessly dangerous to attempt using purely human-performed, manual inspection procedures to assess components in operation under load. If that assessment is what is needed, then technology-assisted or fully automated approaches are the only reasonable choices.
In other cases, I don’t presuppose the outcome. A comparative and objective assessment of performance—manual vs. automated—should always be performed. All approaches, whether manual or automated, have nonzero probabilities of performing unacceptably. Hence, the assessment should be akin to that illustrated in Figure 3. The approach that is statistically least likely to perform unacceptably is the approach that should be used.
At the end of the day, “What gets measured gets managed.” And better measurements almost always lead to better management outcomes in terms of safety, reliability and efficiency.

Dr. Fry is Vice President of Fry Technical Services, Inc. He has 30 years of experience in research and consulting on the fatigue and fracture behavior of structural metals and weldments. His research results have been incorporated into international codes of practice used in the design of structural components and systems, including structural welds, railway and highway bridges, and high-rise commercial buildings in seismic risk zones. He has extensive experience performing in situ testing of railway bridges under live loading of trains, including high-speed passenger trains and heavy-axle-load freight trains. His research, publications, and consulting have advanced the state of the art in structural health monitoring and structural impairment detection.