Sharper Angles, Deeper Dives
Written by Andrew Corselli
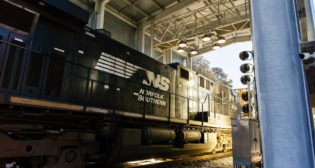
Sperry photo
RAILWAY AGE, JUNE 2020 ISSUE: Geometry—for many, one of the least-favorite school subjects (“When are we ever going to actually use this stuff?!”)—is imperative to the rail industry. Finding faults, on the other hand, is a preoccupation for some people. But for railroads, it’s also critical. Safety depends upon both.
Track Geometry
Track geometry is an important data stream that provides information on track condition, as well as its performance over time or deterioration rate. And much like teaching methods over the years, track geometry has evolved, says Russ Newberg, Director of Operations – RMSS, Holland. “It started with doing basic geometry testing for a few different data channels,” he says. “Collecting surface and alignment impacts were added. Now, it also includes defects that have evolved over time.”
Holland performs GRMS (Gage Restraint Measurement System) testing. “That takes looking at the rail from a static measurement and how it’s laying to what it would look like dynamically,” Newberg says. “We incorporate that with rail profile, taking the rail measurement and looking at it from a cross section. We can conduct rail and tie wear analysis and perform predictive maintenance for tie replacement planning, rail grinding and related maintenance work.”

Jim Hyslip, Ph.D., P.E., HyGround/Loram, concurs with Newberg, adding that track geometry has evolved from “old mechanical systems” prior to the 1960s to “inertial-based systems” that enable higher measurement speeds and other such benefits. Technology has accelerated this evolution.
“One of the big things was recognizing that there’s more information in the geometry data than just the position of the tracks,” Hyslip says. “You can start using it to obtain further information. A big reason we’re able to use geometry data more effectively now for things other than just looking at track roughness is computers, obviously, but also good positioning systems—the computing power that allows us to manage and analyze Big Data sets.
“The location determination systems developed during the past decade or so, with higher-accuracy GPS and better hardware, make data management a lot more efficient. We can overlay subsequent data runs. Aligning the geometry well—and it’s a lot easier to do that now because there’s more accurate location assigned to it—allows trending of geometry condition over time and seeing things like how roughness is developing over time, what the deterioration rate is.
“When we take things like geometry data, which is a routine measurement, and obtain other information about it, like what might be causing roughness and how it could be deteriorating over time, we can start integrating information I refer to as top-of-rail performance, from the geometry car to other information, whether it’s rail wear or other track conditions. And we can start seeing the relationship between other types of condition information, like ballast fouling, and how that relates to track deterioration rate. Now, we can monitor that rate with good geometry data.”
Hyslip adds that the most recent geometry development has been the use of autonomous measurement systems that do not require a manned geometry inspection car. The more prevalent use of these autonomous systems, he says, is “the wave of the future.”
Many companies such as Loram use track geometry data collected by their railroad customers. “We don’t collect track geometry data within Loram,” Hyslip says. “We obtain it to look at overall condition and deterioration rates. We’re not looking at it from a safety standpoint. The main reason for checking geometry, historically, has been to determine what class of speeds can be run. It’s a safety measure. The tolerances that the FRA applies to geometry are all based on safety. We use it for another data stream that gives us information on track condition, as well as from subsequent runs, its performance over time, or deterioration rate.”

Track geometry tools have become extremely sophisticated. Protran Technology’s Callisto system, for example, “was developed to make gathering track geometry data less complicated,” parent company Harsco Rail says. “This is accomplished by using either a traditional Hy-Rail vehicle equipped with Protran’s hardware on the rear hitch, or on a ProTamp-equipped tamper. Callisto collects and displays all geometry parameters required by the FRA, as well as maintenance and safety thresholds, according to the user-selected track class, in real time. We offer high-quality rail consulting services, cutting-edge technological solutions and individual analysis plans that give railroads the ability to inspect, analyze and predict maintenance. Protran Technology track inspection products deliver detailed insight to railroads on track condition, analyzing current track conditions and planning for future maintenance demands. These inspection products ultimately help railroads understand their track and how to best maintain it, decreasing maintenance costs.”
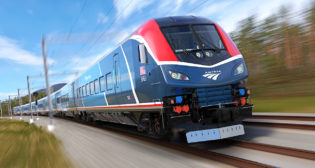
Hyslip says Loram services “all of the major Class I railroads,” as well as Amtrak, which “by far has the most advanced and the longest history of using track geometry data.”
“Amtrak has been a huge customer of ours, collecting track geometry on the high-speed Northeast Corridor every two weeks,” he says. “That’s 24 runs over the course of the year, and by aligning them precisely, we can see roughness, how it’s changing over time, and the maintenance needed to correct it.”
Holland’s Newberg adds that the difference between transit and freight is significant for track geometry. “Geometry testing frequency depends on gross metric tonnage; for each railroad it will be different,” he says. “It also depends on whether it’s freight or passenger. Typical customers will have a minimum of one year, but the frequency could be as often as every 60 days, depending on what type of traffic is running.”
“We are seeing a market shift toward autonomous track geometry measurement technology,” says ENSCO, which has delivered 18 Autonomous Track Geometry Measurement Systems (ATGMS) since 2017. “We believe this shift is due to customer acceptance of, and confidence in, ATGMS technology. As autonomous technology and systems have matured, so has their performance and repeatability. Today, ATGMS provides the same or greater level of performance and repeatability as manned track geometry systems with the added advantage of being installed onboard a revenue vehicle, eliminating the need for a host vehicle and onboard operators.”
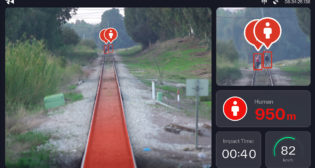
ATGMS measures track geometry and continuously streams the data to a cloud-based server. Railroad personnel are notified instantly of any exceptions via email.
ENSCO’s Autonomous Vehicle/Track Interaction Monitors (VTIs) are another autonomous inspection product “that continues to grow in popularity.” VTIs, installed on board revenue vehicles to measure ride quality, wheel/rail impacts and track geometry surface conditions, “have been credited with helping identify high-risk track conditions and avoid broken rails and derailments.”
The use of autonomous inspection technologies reduces lifecycle cost of inspection operations and allows for high-frequency track inspections where tracks can be surveyed weekly or even daily. “The rise of Big Data has also helped drive interest in autonomous systems, as ATGMS and VTI systems typically provide greater inspection frequency,” ENSCO notes.
Plasser American offers no fewer than eight Track Recording and Measuring Systems. “Our wide spectrum of machines and our customer-oriented development philosophy has led to the fact that a great number of different programmable logic controllers (PLC) and visualization systems are available today,” the company says. “For enhanced user-friendliness, the decision was made to focus development on a system that would meet all special requirements.” For example, Plasser’s T2000, equipped with ENSCO’s Track Geometry Measuring System, offers gauge measurement, cross-level, curvature, profile, alignment, automatic location detection, paint spray, ride quality measurement, Differential GPS and video.
Rail Flaw Detection
Track geometry’s cousin, rail flaw detection (RFD), is equally important to safety. Hidden internal defects can lead to derailments and catastrophic wrecks. RFD aims to nip such problems in the bud.

Herzog “combines conventional ultrasonics with more advanced testing methods such as phased array, geometry testing and joint bar inspection,” the company says. “We can offer clients bigger data sets complete with more frequent, accurate results to help them address their particular rail testing goals.”
Herzog offers three vehicle platforms fitted with multi-channel ultrasonic testing hardware “to efficiently traverse different classes of track.” The Hyrail Freightliner, for main line track inspections; the Hyrail Pickup for mountainous regions and urban settings; and the Hyrail UTV, for use in sidings, yards and areas with tight clearance envelopes. Transducers are mounted to the vehicle’s testing carriage at standard industry probe angles to find different types of defects in the rail. Once on the track and ready to test, Herzog employs a different rail testing process according to the specific requirements of each railroad.
In Start/Stop Verification, after a defect is identified, the operator stops the detector car, steps out of the vehicle and manually confirms if the defect is indeed present using a portable ultrasonic device.
In Continuous Testing (CT), the rail is scanned in bulk mode and test data is transferred in real time to an off-site location for analysis by a qualified technician. Any indications that are suspect are then sent back to a field operator for subsequent on-site verification within a specified time frame.
“Most Class I’s have FRA waivers to perform CT,” Herzog says. “CT reduces track time needed for testing and allows more miles to be tested with increased frequency.”
Sperry Rail uses three technologies to inspect rail, says Sperry Rail Vice President, Technology Simon Broomhead. “We use ultrasonic, which is the most common technique around the world, to inspect the head and web of the rail. In North America, we typically use 15 different ultrasonic channels per rail. We also use induction, an electromagnetic technique. It’s proprietary and unique to Sperry. That was the original method of testing rails developed by Elmer Sperry back in 1928. It’s complementary to the ultrasonic tests. Occasionally, we can get transfer defects of the rail head. The newest of the methods is eddy current, which is relatively new to North America. This is used to inspect the rail surface. It penetrates about a fifth of an inch, five millimeters, down, so it’s very useful for finding rolling contact fatigue. We use all three in combination, along with integration into our vision system.”
Sperry uses these technologies in two different processes. “The original process in North America is what we call ‘stop and verify,’” Broomhead says. “That’s when the rail flaw detection process is completed in a single vehicle pass, typically at low speed. Basically, the rail flaw detection car progresses on the track, the inspection system collects data, processes it from the ultrasonics, and presents that to an operator in pseudo real time, in the form of a picture. The operator has to be a trained NDT (non-destructive testing) technician who is able to analyze those scans in real time. If there is a suspect indication, the operator stops the vehicle, exits it, and performs a hand test to size it and confirm it. The track is then marked, and a repair team will cut it out and replace the rail. That was the only method that used to be allowed under the regulations in the U.S.
“Sperry pioneered what we call Non-Stop Testing, introduced in the 1990s. It divides the rail flaw detection process into two stages. Test data collected at speeds up to 50 mph is uploaded to an analysis center and reviewed by experts who determine the locations requiring manual verification. Ultrasonic experts then perform manual verification. That’s now becoming dominant in North America.”
Nordco uses ultrasonic exclusively. “We’ve got a 32-channel system consisting of 16 transducers per side set up at different angles in the rail head and web,” Rick Wall, Nordco’s Director of RFD Operations, says. “There are forward-looking and reverse-looking transducers. Sound waves are produced with a ‘spider web effect’ to make sure we get every angle covered, giving us a B-Scan image in real time. We pinpoint it, back up, then move ahead and hand test it to pinpoint exactly where the location of the flaw is.”
Wall says RFD eliminates about 95% to 99% of rail flaw-caused derailments, but it can’t account for things like broken axles or broken wheels. Anomalies for switching are not caught by RFD, he says. He adds that, much like track geometry work, RFD maintenance depends upon traffic volume.
“If you have a busy railroad, testing could occur up to every 30 days,” he says. “It’s dependent on actual tonnage. FRA sets a minimum standard on how many MGTs can cross the rail before it has to be checked. As long as we test the rail more frequently than the FRA demands, the railroad is OK.”
Sperry’s Broomhead says the future of RFD is based in technology: “One of our key developments is the use of AI (artificial intelligence) to analyze the B-Scan, which is like a CT scan in the medical profession. We spent a lot of time developing AI to recognize downloads. It’s revolutionizing the way we handle and process data.”