Railcar Manufacturing Slips in 1Q2020
Written by William C. Vantuono, Editor-in-Chief
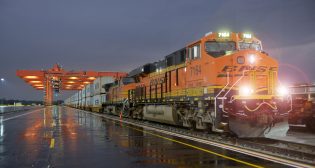
Carbuilders delivered 10,824 railcars in 1Q2020, 26.5% lower than the 14,727 delivered in 4Q19. William C. Vantuono photo.
The Railway Supply Institute American Railway Car Institute (RSI-ARCI) 1Q2020 railcar industry order, delivery, and backlog statistics show that orders in the quarter moderated y/y to 6,172 cars vs. 9,663 in the prior-year quarter and down sequentially from 8,464 cars in 4Q19. The industry delivered 10,824 railcars in the quarter, 26.5% lower than the 14,727 railcars delivered in 4Q19. The backlog now stands at 46,330 railcars, down 9.7% from 4Q19’s 51,295 cars—the lowest backlog figure since 4Q10’s 22,658.

The backlog implies a net cancellation of 313 railcars, consisting primarily of tank cars and some gondolas,” report Steve Barger, Kenneth Newman and Carl Schemm of KeyBanc Capital Markets. “Industry book-to-bill came in at 0.57x, in line with the past quarter’s figure of 0.57x, but below 1Q19’s 0.73x. In the quarter, respective book-to-bill for tank and non-tank activity was 0.75x and 0.41x, vs. 0.48x and 0.65x, respectively, in 4Q19.


“Orders decelerated on both a y/y and sequential basis. In the quarter, they totaled 6,172, which is down ~36% y/y from 9,663 railcars in 1Q19, and down ~27% from 4Q19’s total of 8,464. Non-tank orders totaled 2,289 railcars in the quarter vs. 5,406 non-tank cars in 4Q19. Covered hoppers totaled 2,120, or 34% of the total orders, vs. the past quarter’s 43%, with large-cube covered hoppers representing the majority of orders at 1,493 cars, vs. 2,621 railcars in 4Q19. Orders for medium-cube and small-cube covered hoppers were 607 and 20, respectively, vs. 989 and 0 cars, respectively, in 4Q19. Industry orders for tank cars totaled 3,883 vs. 4Q19 orders for 3,058 tanks. Together, tank and covered hoppers accounted for ~97% of total orders in the quarter vs. ~79% in 4Q19.

“Deliveries fell ~18% y/y and ~27% from 4Q19 levels. They totaled 10,824 in the quarter (5,203 tank cars and 5,621 non-tank cars). 1Q20 tank deliveries decreased ~18% sequentially, but were up ~37% y/y. We think current deliveries imply the industry has ~4.7 quarters of tank backlog visibility. “The backlog saw further declines. It now stands at 46,330, down ~10% from 4Q19’s 51,295. On current deliveries, we think the backlog implies ~4.3 quarters of theoretical production visibility. The tank backlog decreased to 24,262 cars vs. 26,318 in 4Q19. The non-tank backlog decreased ~12% to 22,068 from the past quarter’s 24,977. We note total industry backlog is the lowest level seen since 4Q10’s 22,658, with the tank backlog lowest since 2Q18’s 24,154, and the non-tank backlog the lowest since 4Q13’s 17,551. We note the concentration of car types in current backlog remains consistent with recent quarters, including 52% tank and 37% covered hopper.”