KeyBanc: “Strength beyond our expectations”
Written by William C. Vantuono, Editor-in-Chief
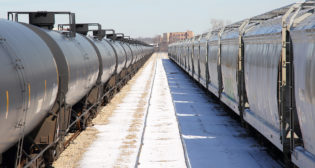
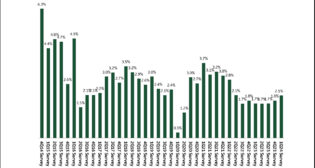
The tank car backlog in 4Q18 increased to 34,512 vs. 31,473 in 3Q18. William C. Vantuono photo.
Fourth-quarter 2018 freight car order, delivery, and backlog figures compiled by the Railway Supply Institute represent a sustainable longer-term market for carbuilders, according to analysis conducted by Steve Barger, Kenneth Newman and Ryan Mills of KeyBanc Capital Markets. Orders were “strong” at 19,955 cars. Carbuilders delivered 13,462 units. The backlog now stands at 80,223—the highest level since 2Q16.
“The backlog implies a net cancellation of 82 railcars, consisting primarily of medium-cube covered hoppers, though this is mostly offset by net increases in flat cars, tank cars, and gondolas, among other car types,” the analysts noted. “Industry book-to-bill came in at 1.5x, below last quarter’s figure of 2.2x, and higher than 4Q17’s 0.6x. In the quarter, respective book-to-bill for tank and non-tank activity was 1.7x and 1.4x, vs. 4.2x and 1.6x, respectively, in 3Q18.”

“Orders sustain strength beyond our expectations,” KeyBanc said. Orders in the quarter totaled 19,955 railcars, which is down sequentially from 3Q18’s total of 24,972—the strongest level since 4Q14—and up about 135% from 8,501 railcars in 4Q17. While we expected a sequential decline given the strength of last quarter’s total, we think 4Q18 orders support continued trends for robust demand in the industry and could be viewed as better than anticipated from most who follow the industry.”
Non-tank car orders totaled 13,942 railcars in the quarter vs. 13,656 in 3Q18. Covered hoppers totaled 3,998, or 20% of total orders, down 4% from the prior quarter, with medium-cube covered hoppers representing the majority of the orders at 2,368 cars vs. 1,265 railcars in 3Q18. Orders for large-cube and small-cube covered hoppers were 1,630 and 0, respectively, vs. 3,760 and 920 cars, respectively, in 3Q18. Tank car orders were 6,013, vs. 3Q18’s 11,316. Together, tank and covered hoppers accounted for about 50% of total orders in 4Q18, vs. about 69% in the prior quarter.

Deliveries were approximately flat y/y and up 20% from 3Q18 levels—13,462 (3,529 tank cars and 9,933 non-tank) vs. 11,221 in 3Q18. 4Q18 tank car deliveries increased about 31% sequentially, and were up about 58% y/y. “We think current deliveries imply the industry has roughly 10 quarters of tank car backlog visibility,” KeyBanc said.
The backlog is at its highest level since 2Q16—80,223 railcars, up about 9% from 3Q18’s 73,812. “On current deliveries, we think the backlog implies roughly 6 quarters of theoretical production visibility,” KeyBanc noted. The tank car backlog increased to 34,512 vs. 31,473 in 3Q18. The non-tank backlog increased about 8%, to 45,711, vs. 3Q18’s 42,339.
“We think the industry backlog continues to trend toward a more ‘normalized’ concentration of car types, consisting of 43% tank and 31% covered hopper,” said Barger, Newman and Mills.