Freight car market remains healthy: Economic Planning Associates
Written by William C. Vantuono, Editor-in-ChiefDemand for freight cars remains at a healthy level “in spite of a sluggish economy and extremely soft financial performances by the railroads,” Economic Planning Associates (EPA) said in its most recent quarterly railcar forecast, issued July 31, 2015.
Orders for rail equipment advanced from 15,952 units in the first quarter to 19,786 cars in the second quarter. And, in spite of some cars dropping out of the backlogs in the second quarter, midyear 2015 backlogs stood at the robust level of 135,800 cars, EPA noted.
“Based on current assembly rates, there are 6.3 quarters of railcar production in the end of June backlogs, implying continued strong levels of assemblies for a number of quarters to come,” EPA said.
“While second quarter financial performances by the railroads were adversely affected by steep declines in coal traffic, we expect stronger economic activities to bolster railroad revenues and profits during the remainder of this year and throughout 2016. This will serve to support future demand for railcars.
“With the exception of coal cars, all other car types are expected to advance at a strong pace due to either expansion of traffic or replacements of aged equipment. Due to the weakness in coal cars and lower than anticipated first-half assemblies of boxcars and mill gondolas, we have moderately lowered 2015 deliveries to 86,000 railcars. Based on somewhat stronger orders and backlogs for other car types, we have raised our 2016 deliveries estimate to 81,800 cars. After 75,500 cars are assembled in 2017, deliveries will remain at the healthy annual level of some 73,000 to 74,000 cars through 2020.
EPA goes on to analyze specific railcar types:
“Demand for boxcars continues to mount as TTX looks to upgrade a portion of its general service boxcar fleet. Second quarter orders of 2,940 cars far exceeded assemblies of 125 cars, sending end of June backlogs to the lofty level of 7,158 units.
“In the past, we had noted that there seemed to be little support from individual investors or owners of boxcars other than TTX. However, we now believe that some refrigerated boxcars were ordered in the second quarter by the railroads to upgrade their fleets. Based on the momentum in second quarter orders, modest production runs and first half backlogs, we are looking for deliveries of only 1,000 boxcars this year before a strong rebound to 3,000 cars in 2016.
“Production of all types of covered hoppers will be strong over the next five years.
“Demand for hi-cube covered hoppers continues to expand. After 2,328 units were ordered in the first quarter, second quarter orders amounted to 1,867 cars. As a result, first half orders of 4,195 far outpaced assemblies of 1,657 units, raising backlogs from 10,490 cars at the beginning of this year to 13,028 units at mid year.
“Due to the strength in current backlogs and the anticipation of continued growth in the corn to ethanol process, which will keep DDG demand on a high note, we look for deliveries of some 4,500 hi-cube covered hoppers this year and 6,000 cars in 2016. From 2017 through 2020, deliveries will be in the range of 4,000-5,000 cars per year.
“Demand for midsized covered hoppers continues to be strong. After 5,922 cars were ordered in the first quarter, additional orders for 6,572 cars were placed in the second quarter. And, with first half orders of 12,494 cars far outpacing revised assemblies of 1,415 units, backlogs have jumped from 9,856 cars at the beginning of the year to 21,502 units at mid year.
“Due to lackluster first half assemblies, we have lowered our 2015 deliveries estimate to 3,500 cars, but raised our 2016 assemblies estimate to 7,000 units based on extremely high current backlogs. After 6,500 cars are assembled in 2017, we expect midsized deliveries of 6,000 cars per year from 2018 through 2020.
“Orders for small cube equipment picked up slightly in the second quarter, but the story in this sector is the 11,792 cars that were assembled in the first half. And, with midyear backlogs of 28,027 units, we are once again raising our 2015 deliveries to 23,000 cars. Next year, we still look for deliveries of 15,000 units.
“Longer term, in addition to the energy sector, continued growth in construction spending, steady expansions in the chemical and food processing industries, and the intensifying pressure to replace extremely aged cars in the fleet will keep annual demand high. From 2017 through 2020, we look for deliveries to ease gradually from 12,000 to 7,000 cars.
“Demand for coal cars is nonexistent. Industry sources inform us that the 1,271 GT steel gondolas ordered in the second quarter are destined for ore service while the 698 steel hopper cars ordered in the second quarter are primarily for aggregate service. The absence of any current demand for coal equipment is due to the dismal coal environment.
“The coal situation continues to deteriorate. In the first quarter, railcar loadings of coal were running 3.2% below the similar period of 2014. However, coal consumption by the electric utilities declined 15.0% in the first quarter and utility stock piles of coal amounted to 155.5 million tons at the end of March, 37.2 million tons higher than the March 2014 level of 118.3 million tons. And, the foreign sector was also disappointing earlier this year. Through April, exports of coal were running 18.6% below last year. As a result, it is not surprising to note that the first half rail movements of coal were 9.4% lower than the first half of 2014.
“Based on extremely low backlogs and little, if any, demand for coal cars, we expect GT steel gondola deliveries of 750 cars this year and 1,000 units in 2016. GT aluminum deliveries are estimated at 250 units this year and 500 cars in 2016. Steel hopper car deliveries will amount to 1,500 units this year and 1,500 cars next year. We anticipate no aluminum hopper car deliveries this year and only 250 deliveries in 2016.
“Longer term, assemblies of GT gondolas and hoppers will expand modestly to 5,000 units by 2020. At this point, in addition to replacements, it is hard to conceive that coal emissions would not be reduced sufficiently enough to once again utilize coal in electricity generation while natural gas moves more steadily into residential markets and petroleum moves into transportation fuels such as gasoline and jet fuel. A revival in coal exports will also provide stimulus for growth in coal carrying equipment in the years to come.
“Demand for intermodal equipment was quiet in the first half as no new orders were placed for either articulated or nonarticulated platforms and cars. However, in spite of 3,608 assemblies in the first half, backlogs at the end of June stood at the healthy level of 8,643 platforms.
“Intermodal developments remain a dynamic element in the railroad environment. Due to relatively weak manufacturing and export sectors, first-half intermodal haulings advanced only 2.7% as a 3.0% increase in container movements was dampened by a 0.1% advance in trailer traffic. However, we anticipate stronger expansion in intermodal movements as we proceed through the rest of this year and into 2016.
“Based on current backlogs and an anticipation of stronger future growth in demand for intermodal equipment, we look for deliveries of 7,500 units this year and 10,000 units in 2016. From 2017 through 2020, deliveries of cars and platforms will gradually expand from 12,000 units to the level of 15,000 units.
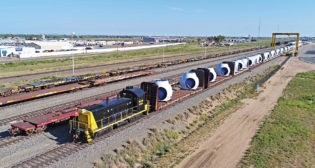
“Demand for nonintermodal flat cars continues to expand. After orders for 1,465 units in the first quarter, further orders for 1,930 cars were placed in the second quarter. In spite of first half assemblies of 2,025 cars, orders of 3,395 units raised backlogs from 4,171 cars at the beginning of the year to 5,047 cars at mid-year. However, we have noted some evaporation of cars from the backlogs in the second quarter. Nonetheless, based on current backlogs and production trends, we have raised our 2015 deliveries estimate to 4,000 cars. Next year, we expect deliveries of 3,000 cars.
“The eventual recoveries in the major non automotive customer markets will serve to keep annual Class F deliveries at about 2,500 cars per year from 2017 through 2020. Demand for mill gondolas continues to advance. After orders for 1,095 units were placed in the first quarter, 555 cars were ordered in the second quarter. As a result, first half orders for 1,650 cars far outpaced assemblies of 832 cars, raising backlogs from 2,446 units at the beginning of the year to 3,264 cars at the end of June.
“Based on first half backlogs and a sluggish industrial sector, we expect deliveries of 2,000 GB gons this year. Next year, an improving manufacturing sector will lead to deliveries of 2,500 GB gons. From 2017 through 2020, deliveries will average 2,000 cars per year.
“Demand for tank cars continues to moderate. After 4,470 units were ordered in the first quarter, 3,155 cars were ordered in the second quarter. With assemblies of 18,875 cars in the first half, backlogs declined from 57,625 at the beginning of the year to 46,375 units at the end of June.
“While we are still optimistic on the long term outlook for U.S. oil production and rail movements of crude oil and petroleum products, we are concerned about the current slowing in petroleum product demand as the U.S. economy remained sluggish during the first half of this year. Indeed, after rail movements of oil and petroleum products advanced 30.9% in 2013 and 12.7% in 2014, haulings of crude oil and petroleum products during the first half of 2015 were running 1.4% below the previous year.
“The current energy environment is sluggish, at best, and we had noted a slowing in second quarter orders and assemblies of tank cars. As a result, we are moderately lowering our 2015 tank car deliveries estimate from 40,000 to 38,000 cars. Next year, we still expect deliveries of 32,000 units.
“After 2016, demand for tank cars will be led by expanding oil production and will also be supported by replacements of certain cars. As such, we look for deliveries of some 30,000 tank cars each year from 2017 through 2020.”