Commentary
Let’s Play ‘Connect the Dots’
Written by William C. Vantuono, Editor-in-Chief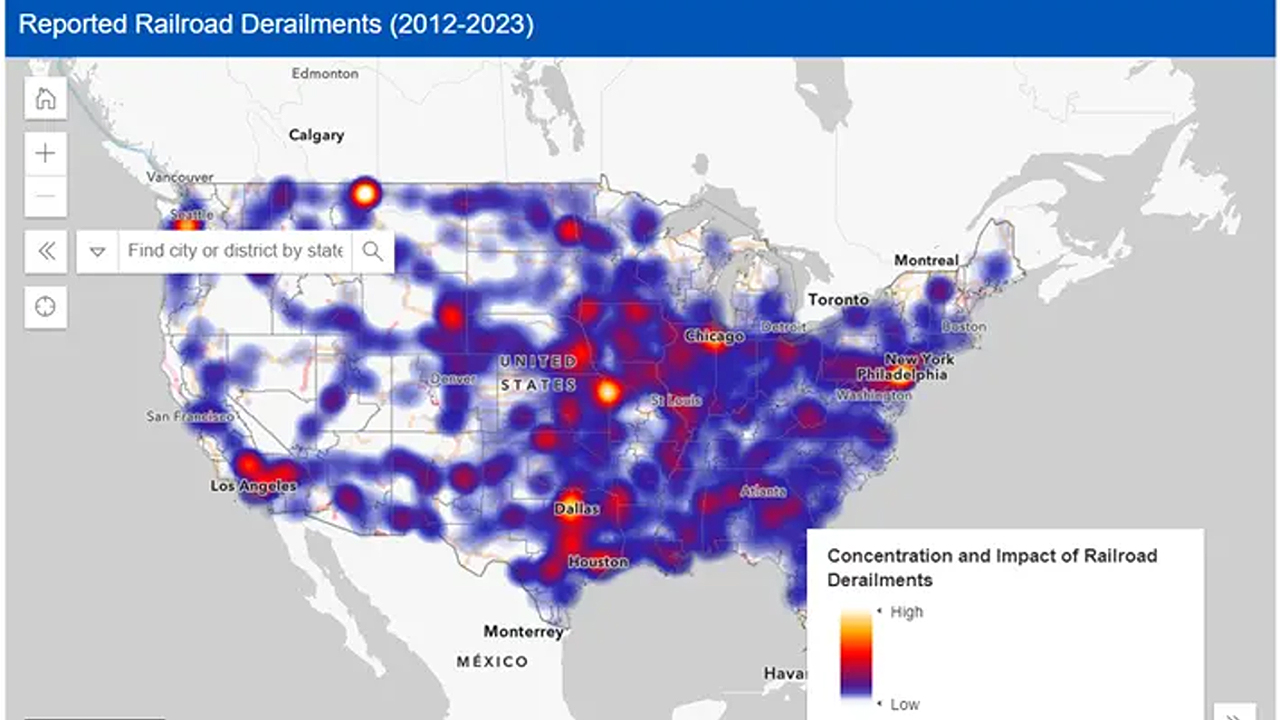
Try this as an “artistic” exercise: Collect reams of disconnected data. Stuff them into a blender. Add water. Press the “chop” button. Allow the blender to pulverize the data into a multi-color blend. Extract pieces of said blend with a large turkey baster. Then, squirt it in various-sized dots across a railroad map of the United States.
This is what the National League of Cities (NLC) appears to have done when it created its “interactive map showing the frequency of train derailments across the country.” The map “allows users to see an overview of derailments and dive deeper into details on specific incidents.”
At first glance, the map looks like a collection of bomb detonations ranging from the conventional yet powerful GBU/B Massive Ordnance Air Blast to a nuclear ICBM strike. The big picture is scary, clearly meant, in my opinion, to frighten the public into thinking that the U.S. railroad network is a battlefield populated with wrecked trains and human casualties. Oh, the humanity!
NLC notes that its map “displays railroad derailments (what other types are there?) between 2012 and 2023 as compiled by the U.S. Department of Transportation’s Federal Rail (sic.) Administration. The map accounts for all railway networks in the U.S. and the congressional districts where derailments occurred.”
“Our new rail (you mean “railroad,” right?) map shows what local leaders already know to be true—train derailments and safety issues are happening far too often and in far too many places,” NLC says. “Every day in the U.S., an average of three trains derail with as many as half potentially carrying hazardous substances. Communities are calling on Congress to move legislation to ensure that rail moves safely in America.”
Well, they’re not happening “far too often.” The majority of derailments are minor, occurring at low speeds in yards. Nearly 100% of rail-transported hazmat reaches its destination without incident. I suppose none of this is newsworthy …
And by the way, rail doesn’t move (well, it’s not supposed to). Trains move. But enough nitpicky editing.
To create this somewhat pointless piece of pointillism, NLC used Federal Railroad Administration data supplemented by data from ESRI, the U.S. Census Bureau, Congress, the Bureau of Transportation Statistics, EPA, HERE Technologies, Garmin, NOAA and USGS. The data sources are all good, but again, the result is deeply flawed and highly misleading.
I as well as a trusted industry colleague took a “deep dive” into this railroad version of Connect the Dots. It wasn’t easy. Try it out.
Here’s one problem: The map includes Amtrak accidents in addition to freight. The green bomb blasts … er, bubbles, represent derailments with injuries. The larger the size, the greater the number of injuries. When you click on the larger bubbles, it’s clear that a significant share of these larger-injury incidents are Amtrak accidents, such as the big Pennsylvania bubble that represents the 2015 Amtrak Northeast Corridor overspeed wreck that resulted in 8 fatalities and 241 injuries. Amtrak’s 2017 Dupont, Wash. accident is another big green bubble. Both these accidents were PTC-preventable. Since PTC is now in place, using these accidents to call for passage of the Rail Safety Act (an unnecessary piece of legislation) is disingenuous and misleading, since those types of accidents have been addressed.
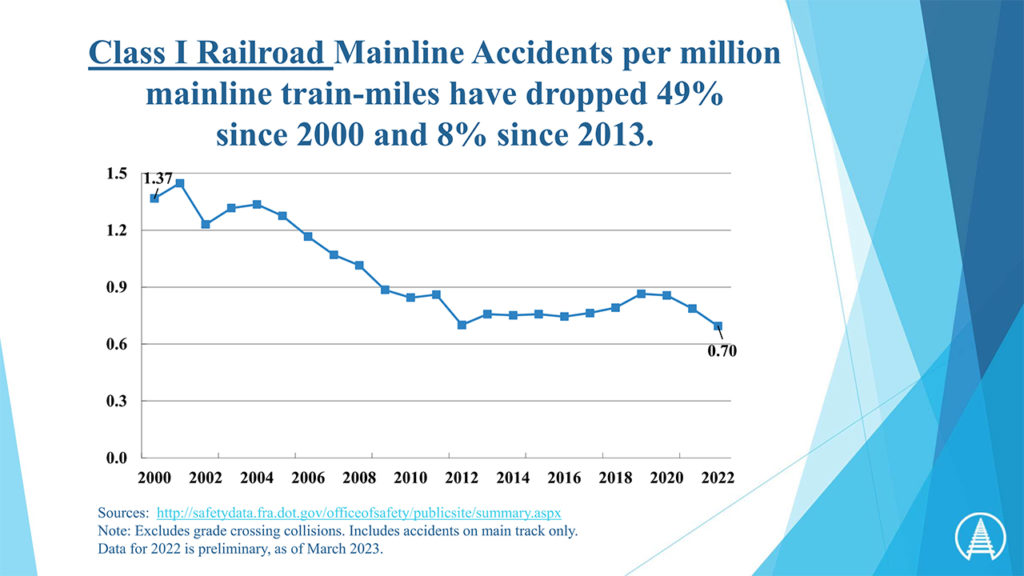
“Safety conditions today on the railroad network are not what they were 10 years ago,” my colleague accurately points out. “We’ve got PTC, risk reduction programs, greater use of ATI (automated track inspection), improved AskRail access, etc. Putting 10 years’ worth of derailments on one map vs. showing the trend line over the same period makes something from 10 years ago seem just as likely to happen today as it would have in 2012. That’s simply not the case.”
Here’s the Class I main line accident rate trend that is a far better representation of the industry’s safety record. It shows that 2022 had one of the lowest rates ever for such accidents:
I do not understand why the National League of Cities, which works closely with the industry (through the Association of American Railroads) on first-responder/community planning outreach programs, would produce this thing in the first place. What can they be thinking? Politics over substance? Over facts? Over accuracy? It doesn’t serve any real purpose.
So, can we say that the NLC is blowing smoke as well as bubbles?
Any politicians interested in holding hearings on highway accidents and fatalities? I’m told they occur in far greater numbers. According to the National Safety Council, a nonprofit organization founded in 1913 and chartered by the United States Congress in 1953, “In 2021, 5,700 large trucks were involved in a fatal crash, an 18% increase from 2020 and a 49% increase in the past 10 years.
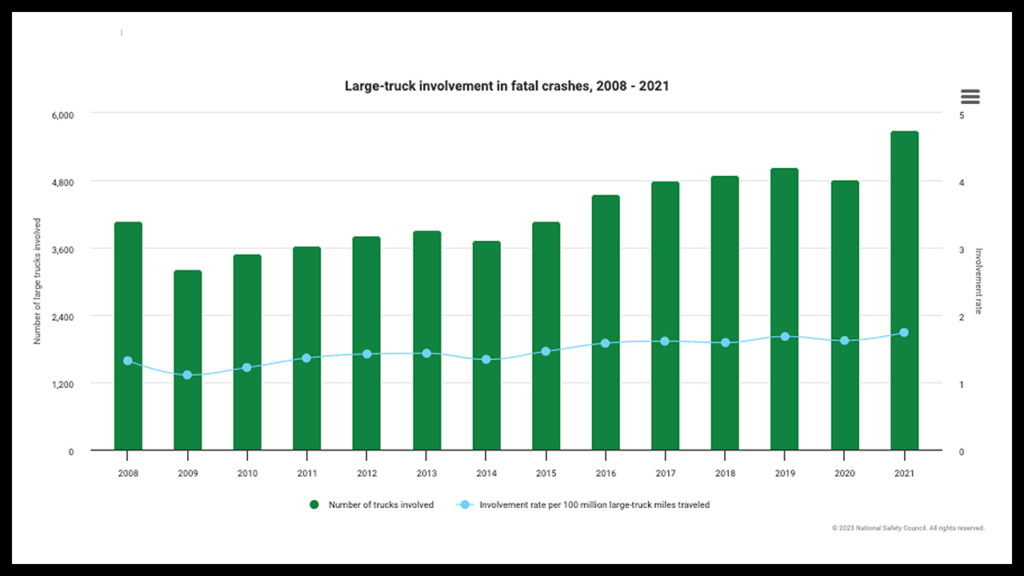
“The involvement rate per 100 million large-truck miles traveled is up 7% from 2020, and up 22% in the last 10 years. Large trucks are defined as any medium or heavy truck, not including buses and motor homes, with a gross vehicle weight rating greater than 10,000 pounds. Both commercial and non-commercial vehicles are included. Large trucks accounted for 9% of all vehicles involved in fatal crashes, 5% of all registered vehicles, and 10% of total vehicle miles traveled.”