U.S. Rail Traffic: July Provides No ‘Definitive Evidence’ on State of Economy
Written by Marybeth Luczak, Executive Editor
“Rail traffic in July was evenly balanced between commodities with carload gains and those with carload declines,” Association of American Railroads Senior Vice President John T. Gray reported on Aug. 3.
“As such, it does not provide definitive evidence regarding the state of the overall economy,” Gray noted in the AAR traffic report for July 2022 and the week ending July 30, 2022. “In that respect, it is very similar to most other recent economic indicators.”
In July 2022, 10 of the 20 carload commodity categories tracked by the AAR each month saw carload gains compared with July 2021. These included coal, up 5,588 carloads or 2.2%; crushed stone, sand and gravel, up 5,197 carloads or 6.7%; and motor vehicles and parts, up 3,726 carloads or 8.2%. Commodities that saw declines included primary metal products, down 7,065 carloads or 19.2%; all other carloads, down 3,311 carloads or 15.1%; and stone, clay and glass products, down 2,202 carloads or 6.7%.
U.S. Class I railroads hauled 906,903 carloads last month, up 0.2%, or 2,213 carloads, from July 2021; and 1,033,906 containers and trailers, down 3%, or 32,094 units. Combined U.S. carload and intermodal originations in July 2022 came in at 1,940,809, down 1.5%, or 29,881 carloads and intermodal units from the same month last year.
Excluding coal, carloads were down 3,375 carloads, or 0.5%, in July 2022 from July 2021. Excluding coal and grain, carloads were down 4,356 carloads, or 0.8%.
Traffic for the previous four months was similar, as observed by Gray:
• “As conjecture grows about the direction of the U.S. economy, June rail traffic doesn’t offer definitive answers on whether a recession is looming or not,” Gray reported on July 6. “Like many other economic indicators today, rail traffic is a mix of red, yellow and green, with some traffic lines, such as automotive, providing generally positive indicators, while others, such as chemicals, being a bit more subdued than they were earlier in the year.”
• “Rail traffic volumes in May reflected an economy that is a mixture of good and not-so-good,” Gray pointed out in a June 1 AAR traffic report. “Auto production and auto carloads seem to be slowly recovering; crushed stone and sand, and food-related volumes are showing strength while intermodal had its best month since June 2021. On the other hand, carloads of chemicals fell for the first time in more than a year in May, while grain volumes continued to be disappointing when compared to those of 2021 and the latter half of 2020.”
• “U.S. rail traffic in April had something for everyone,” Gray reported on May 4. “Optimists can point to autos, chemicals and scrap, all of which had solid gains [over the same period last year]. Pessimists can point to grain, intermodal and petroleum products, which saw significant declines. In the middle are carloads of industrial products—an aggregation of seven key carload categories—which fell slightly in April, consistent with the most recent GDP numbers.”

What was happening in July 2021, July 2020 and July 2019? Let’s look back:
• While U.S. rail traffic in July 2021 was up from July 2020, the percentage increase was “significantly lower” than in other recent months, Gray reported on Aug. 4, 2021. Gray said this was due to “more difficult comparisons and because various external factors have led to a recent deceleration in rail volumes.” He provided examples: “Grain exports are down sharply, taking rail carloads of grain down with them”; “[a]utomakers are still hampered by semiconductor shortages, leading to sharply lower rail auto volumes; and “[w]orldwide supply chain slowdowns are impacting both rail customers and railroads themselves.” Gray explained that “[w]hile all of these should be manageable, temporary setbacks, their convergence has resulted in weaker rail volumes than basic domestic economic factors might otherwise imply.” In July 2021, U.S. Class I railroads originated 904,670 carloads, rising 6.6%, or 55,969 carloads, from July 2020, and they originated 1,066,169 containers and trailers, increasing 1.5%, or 15,450 units. Combined, July 2021’s originations came in at 1,970,839, up 3.8%, or 71,419 carloads and intermodal units from July 2020.
• “The old saying, ‘You have to play the hand you’re dealt’ applies to railroads,” said Gray on Aug. 5, 2020. “Rail traffic, like the overall economy, is generally trending in the right direction, but progress is slow; there’s a long way to go before it’s back to normal; and both week-to-week improvements and setbacks in individual commodities are to be expected. Coal and other energy-related rail commodities continue to struggle more than most, while intermodal is closer than any other rail traffic category to pre-pandemic levels.” U.S. railroads originated 1,042,017 carloads in July 2020, down 17.6%, or 222,337 carloads, from July 2019. U.S. railroads also originated 1,295,960 containers and trailers in July 2020, down 1.4%, or 18,403 units, from the same month in 2019. Combined U.S. carload and intermodal originations in July 2020 were 2,337,977, down 9.3%, or 240,740 carloads and intermodal units from July 2019.
• “Rail traffic in July [2019], as in many other recent months, was held back by declines in three of the largest rail traffic segments: coal, grain and intermodal,” Gray reported on Aug. 7, 2019. “Despite a summer heat wave of historical proportions, very low prices for natural gas have seriously weakened the seasonal demand for coal-generated electrical power. These same low natural gas prices appear to have allowed chemical production to pretty much hold steady even in the face of the uncertainty around foreign trade, which has been the source of much of the recent growth in chemical production. With 50% of rail intermodal business overseas—including international trade, both imports of consumer and intermediate manufacturing components and exports such as food products—trade policy uncertainty continues to drag down this traffic segment. Export grain movements are also facing increasingly serious headwinds from threats to trade policy stability.” U.S. railroads originated 1,264,100 carloads in July 2019, down 4.8%, or 64,406 carloads, from July 2018. U.S. railroads also originated 1,314,333 containers and trailers in July 2019, down 6.1%, or 84,878 units, from the same month in 2018. Combined U.S. carload and intermodal originations in July 2019 were 2,578,433, down 5.5%, or 149,284 carloads and intermodal units from July 2018.

Year to Date 2022
Total U.S. carload traffic for the first seven months of 2022 came in at 6,900,820, down 0.1%, or 6,610 carloads, from the same period last year; and 7,912,632 intermodal units, down 5.8%, or 485,376 containers and trailers.
Total combined U.S. traffic for the first 30 weeks of 2022 was 14,813,452 carloads and intermodal units, a 3.2% decrease from last year.
Week 30 (Ending July 30, 2022)
Total U.S. weekly rail traffic was 505,409 carloads and intermodal units for the week ending July 30, 2022, up 0.6% compared with the prior-year period. After 22 consecutive weeks of total traffic declines, this is the first time a gain has been reported since the week ending Feb. 17, 2022.
Total carloads for the week ending July 30, 2022, came in at 237,079, up 3.6% compared with the same week in 2021, while U.S. weekly intermodal volume was 268,330 containers and trailers, down 1.9% from 2021.
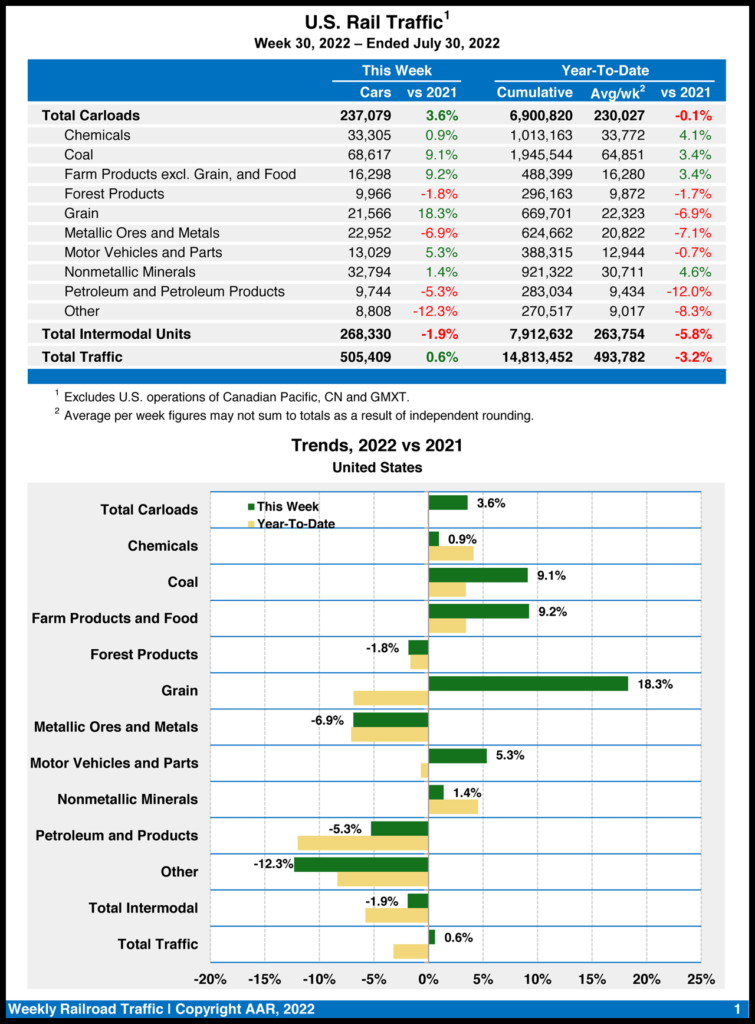
Six of the 10 carload commodity groups posted an increase compared with the same week in 2021. They included coal, up 5,728 carloads, to 68,617; grain, up 3,336 carloads, to 21,566; and farm products excluding grain, and food, up 1,376 carloads, to 16,298. Commodity groups that posted decreases included metallic ores and metals, down 1,700 carloads, to 22,952; miscellaneous carloads, down 1,237 carloads, to 8,808; and petroleum and petroleum products, down 542 carloads, to 9,744.
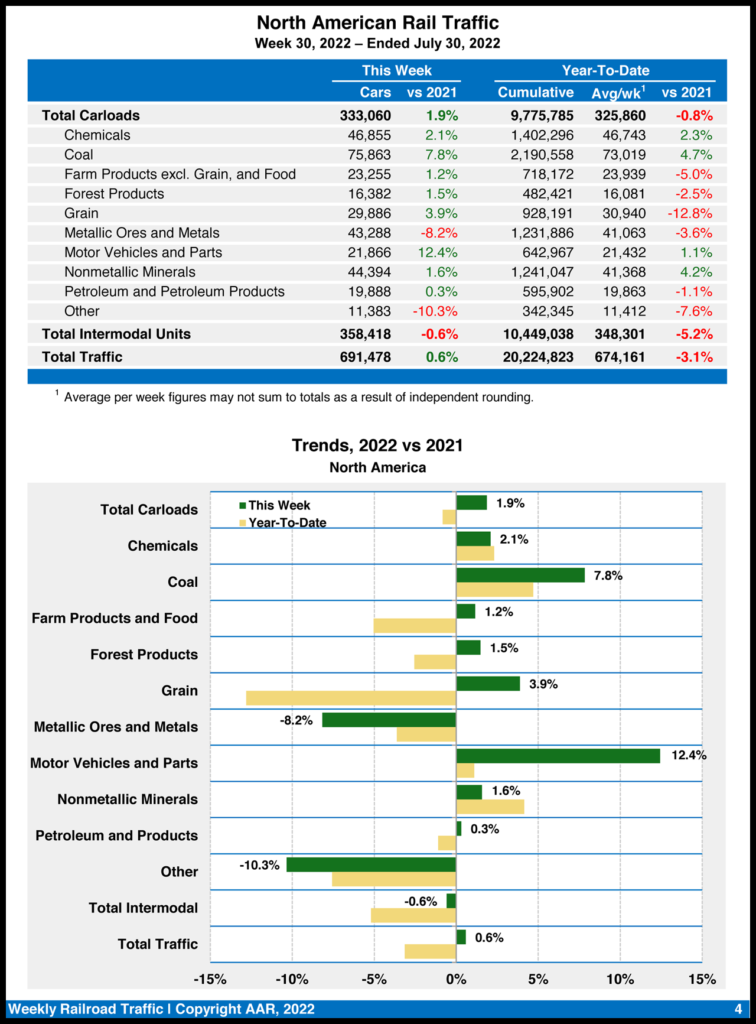
North American rail volume for the week ending July 30, 2022, on 12 reporting U.S., Canadian and Mexican railroads totaled 333,060 carloads, up 1.9% from the same week last year, and 358,418 intermodal units, down 0.6% from last year. Total combined weekly rail traffic in North America was 691,478 carloads and intermodal units, up 0.6%. North American rail volume for the first 30 weeks of 2022 was 20,224,823 carloads and intermodal units, decreasing 3.1% from 2021.
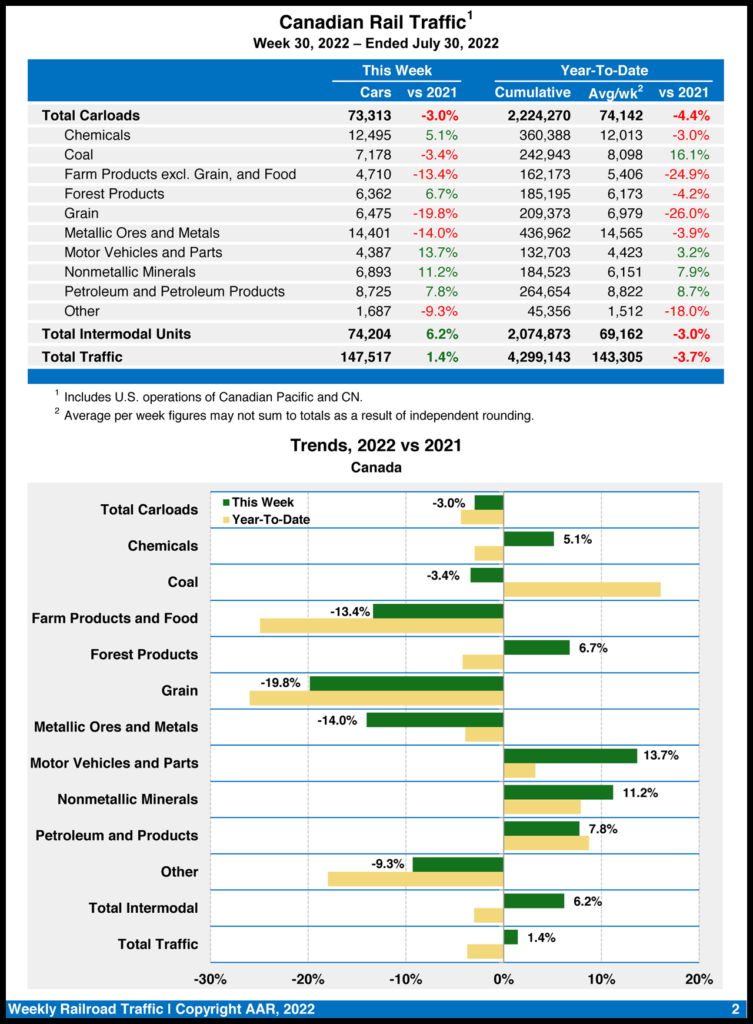
Canadian railroads reported 73,313 carloads for the week, falling 3%, and 74,204 intermodal units, rising 6.2% compared with the prior-year period. For the first 30 weeks of 2022, they reported cumulative rail traffic volume of 4,299,143 carloads, containers and trailers, dropping 3.7%.
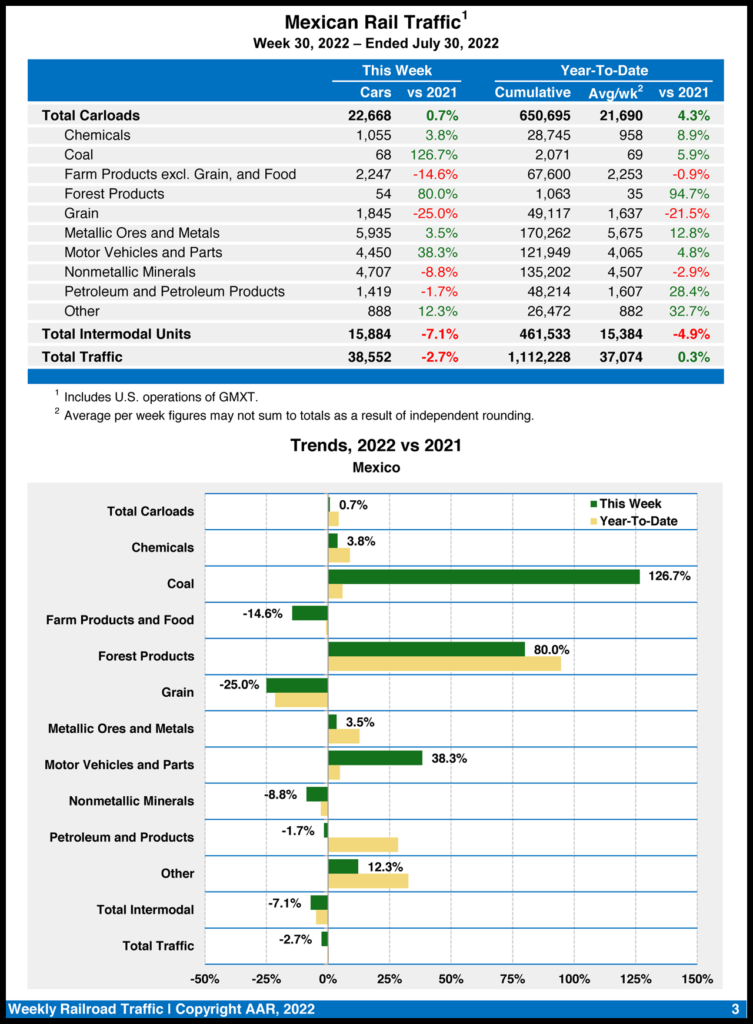
Mexican railroads reported 22,668 carloads for the week, up 0.7% compared with the same week last year, and 15,884 intermodal units, down 7.1%. Their cumulative volume for the first 30 weeks of 2022 was 1,112,228 carloads and intermodal containers and trailers, up 0.3% from the same point in 2021.