Commentary
U.S. Rail System Still Deteriorating, On Balance
Written by Rick Paterson, Managing Director, Loop Capital Markets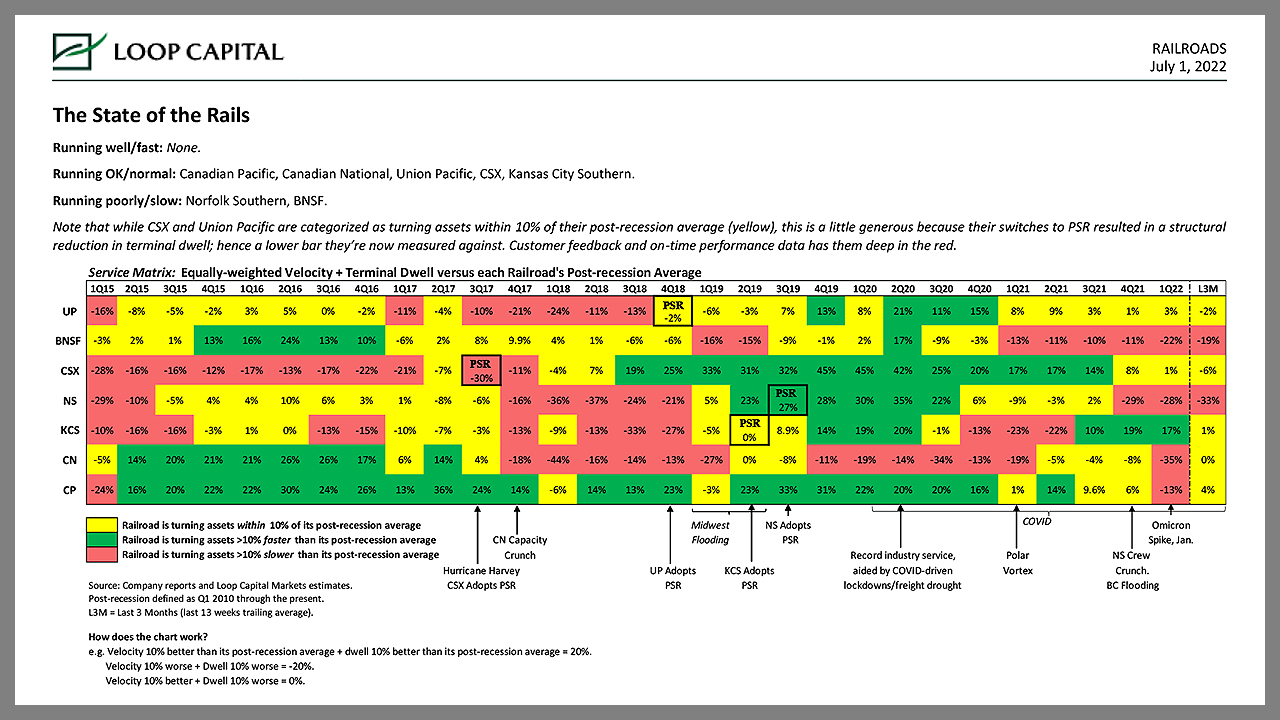
We’re now in the second half of 2022, when the four major U.S. Class I’s have committed to turning their operations around, but the current state of play is not encouraging. Only Union Pacific has made any progress in recent months, but that has been from a low base and fading somewhat over the past two weeks. We would regard UP and Norfolk Southern as now in a “steady state” and it’s the other two we’re more worried about in terms of trajectory.
BNSF’s intermodal business, in particular, is really struggling and in no shape to handle peak season volumes, which typically start around mid-August. Last week, BNSF Intermodal hit new lows in terms of network velocity (28.9 mph vs. 32.3 average in 2021) and on-time performance (only 57% of containers deramped within 24-hours of schedule), and a new high in terms of intermodal cars sitting idle for 48-hours or longer (1,610 out of 19,969 intermodal cars-on-line). To be fair, weather and other external factors had an impact. More broadly, the full system has seen record trains holding for crews over the last six weeks and a high in recrews to 1,789 at a recrew rate of 13.4% last week.
Over in the east, CSX is coming off two bad weeks, recording multi-year lows in velocity and multi-year highs in trains holding for crews, terminal dwell, and the proportion of cars-online sitting idle for 48 hours or more. Last week on-time performance in its manifest network hit a new record low of 64%.
While it pains us to recount these statistics (download the complete State of the Rails report below), for what it’s worth we’re confident both BNSF and CSX have the talent to turn this around and fully expect them to do so, but you can’t start getting better until you stop getting worse and more patience will, unfortunately, be required from all of us.
Fourth of July Double-Edged Sword
Last week we talked about 4th of July as both a blessing and a curse for the US railroads and we’ll dig into that a little more here. On the positive side, the holiday on Monday, subsequent four days of heavily reduced customer activity, and bookending weekends represents the second biggest drop in volume pressure of the year, behind of course the Christmas to New Years period. Historically, weekly volumes temporarily subside by 14% at NS, 13% at CSX, 11% at UP, and 8% at BNSF. These are big drops in volume pressure over a 9-day period, which is both positive and badly needed given the current state of affairs. However…
This period also represents peak summer vacation season, and the networks can obviously ill-afford to lose crews during a crew capacity crunch. In terms of putting some numbers around it, if we look at the monthly seasonality in the four years prior to the pandemic, midmonth crew headcount fell by 0.5% on average from mid-June into mid-July for the US rail industry. For some reason it’s more pronounced in the east, with CSX and NS down 3.3% and 0.8%, respectively, versus -0.2% at UP and +0.5% at BNSF. Clearly these mid-month statistics also understate the crew shortfalls over the first ~nine days of July. By July 15th the heavy vacation effect has partially normalized.
The railroads are of course well aware of this dynamic and no doubt doing all they can to buy out/stagger/delay vacations next week, but it likely won’t be completely successful and we’re still looking at a situation where the opportunity try to improve operations during the volume pressure reprieve will be diluted by temporarily increased crew scarcity.
Crew Deficit: ~4,100
Updating our crew models with the most recent data points for network velocity (last week) results in the following updated estimates with regard to the minimum number of additional crews required to trigger a service recovery. We’ve regressed slightly, with net velocity for the four major systems slightly slower last week, which pushes our estimated crew deficit from ~4,000 to ~4,100.
In terms of predicting the order in which these systems operationally inflect for the better, look at the % Deficit column on the far right. The smaller the number, the closer to recovery.
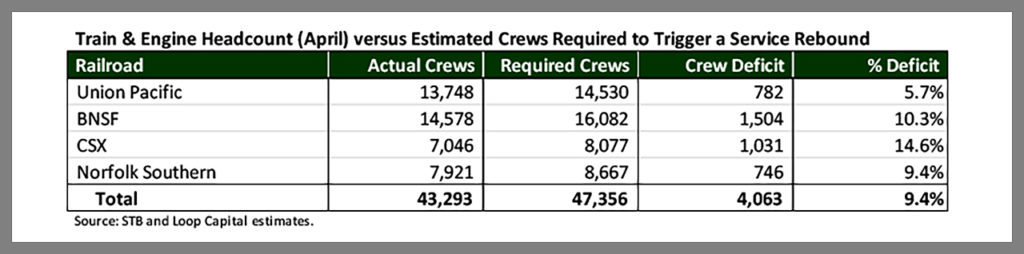
Some of the railroad’s T&E crew headcount numbers (Actual Crews) include trainees, which are higher as a percentage of total now than historically, which in turn makes the crew deficit numbers look slightly better (smaller) than they actually are. When railroads are running poorly, crew capacity is diluted by non-productive crew starts, such as deadheads (repositioning crews by road transport) and recrews (replacing a crew due to an unanticipated expiration of the allowable 12 hours). It will likely take several months before conductor graduates in the field are satisfactorily productive.

Rick Paterson covers the Transportation sector for Loop Capital Markets, including the North American Class I railroads. Prior to joining Loop Capital, he covered the Transportation Sector at Topeka Capital Markets and UBS Investment Bank. Rick previously worked in Intermodal Sales & Marketing and Strategic Planning for the Pacific National Railway in Australia. He testified at the Surface Transportation Board’s April 2022 hearing on “Urgent Issues in Freight Rail Service.”