Intermodal: ‘On the Decline in 2023’
Written by Marybeth Luczak, Executive Editor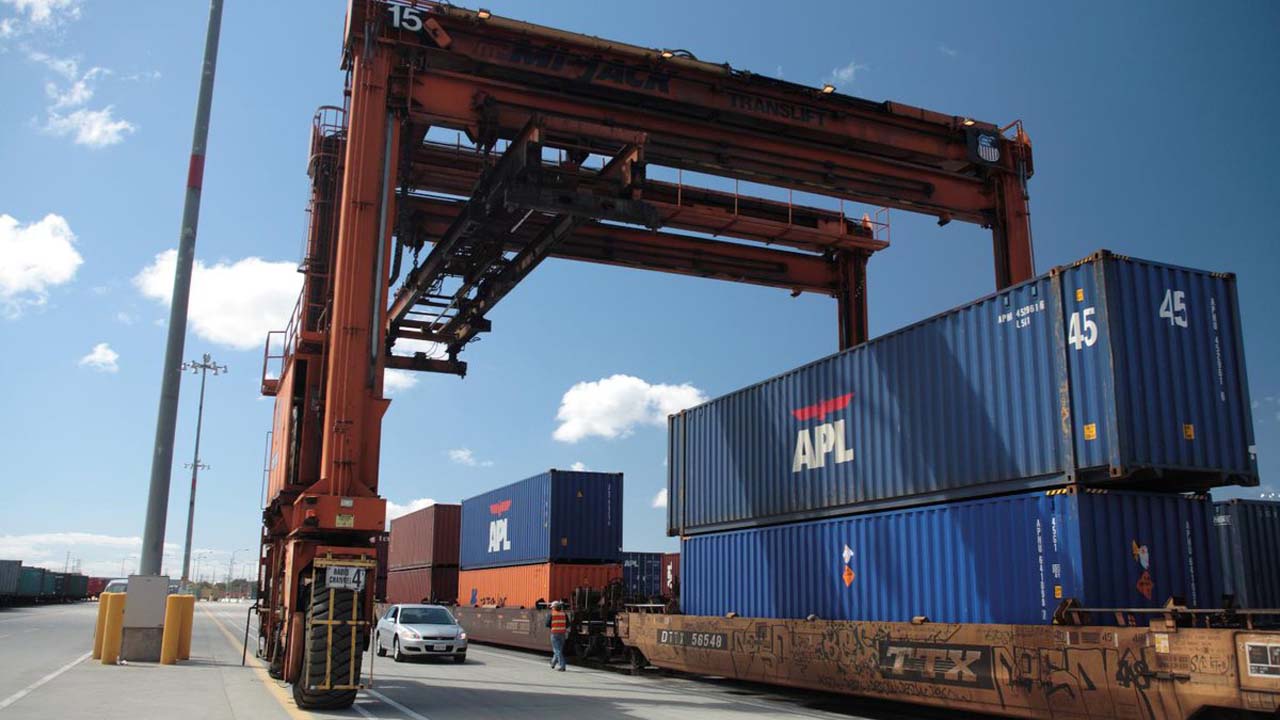
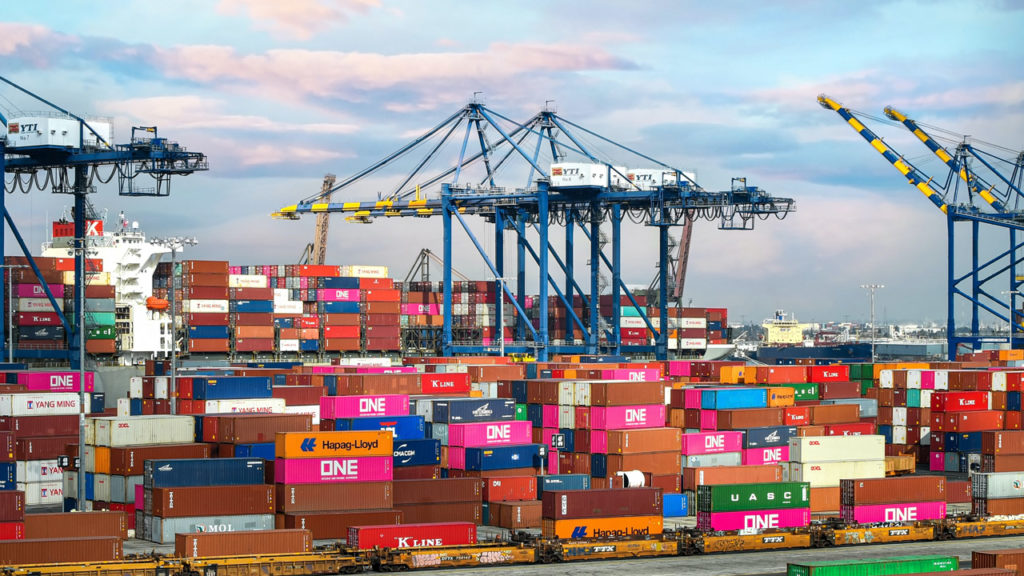
“Roughly half of U.S. intermodal shipments are related to international trade, so what happens at ports is extremely important to railroads,” said John T. Gray, Senior Vice President of the Association of American Railroads (AAR), which on June 7 released a report on U.S. rail traffic for May 2023 and for the week ending June 3, 2023. “U.S. port volumes, especially on the West Coast, have already been trending down for months and are a major reason why rail intermodal volumes have been on the decline in 2023.”
Both May 2023 and the week ending June 3, 2023 saw U.S. carloads rise and intermodal volume drop compared with the prior-year periods, according to AAR. January 2023 and April 2023 results were similar, while February 2023 and March 2023 saw both carloads and intermodal volumes decline.
U.S. railroads originated 1,129,255 carloads in May 2023, up 0.8%, or 8,840 carloads, from the same month last year. They also originated 1,190,553 containers and trailers, down 11.1%, or 148,780 units, from 2022. Combined U.S. carload and intermodal originations in May 2023 were 2,319,808, down 5.7%, or 139,940 carloads and intermodal units, from May 2022.
Last month, nine of the 20 carload commodity categories tracked by AAR each month saw carload gains compared with May 2022. These included motor vehicles and parts, up 11,464 carloads or 17.0%; crushed stone, sand and gravel, up 10,207 carloads or 10.2%; and petroleum and petroleum products, up 3,968 carloads or 9.4%. Commodities that saw declines included grain, down 12,916 carloads or 12.2%; coal, down 5,389 carloads or 1.7%; and all other carloads, down 2,528 carloads or 9.8%.
Excluding coal, carloads in May 2023 were up 14,229 carloads, or 1.8%, from the year-earlier period. Excluding coal and grain, carloads were up 27,145 carloads, or 3.9%.

What was happening in May of 2019, 2020, 2021 and 2022? Let’s review.
May 2019
May 2019 was “bleak” compared with the same month in 2018. “The current weakness in the rail traffic numbers is due to a combination of factors,” Gray reported June 5, 2019. “These include flooding in the Midwest that’s been hindering the operations of railroads and many of their customers. More important is heightened economic uncertainty that’s being made worse by increased trade-related tensions; higher tariffs leading to reductions or disruptions of international trade, and lower industrial output. In addition, some rail markets are undergoing rapid change. For example, locally sourced frac sand in Texas is displacing sand that used to be shipped in by rail. Just by themselves, these reduced sand movements are having a material negative impact on total rail carloads.”
U.S. railroads originated 1,291,671 carloads in May 2019, down 2.1%, or 28,065 carloads, from May 2018. U.S. railroads also originated 1,315,684 containers and trailers in May 2019, down 5.9%, or 82,521 units, from the same month in 2018. Combined U.S. carload and intermodal originations in May 2019 were 2,607,355, down 4.1%, or 110,586 carloads and intermodal units from May 2018.
In May 2019, six of the 20 carload commodity categories tracked saw carload gains compared with May 2018. Among these were petroleum and petroleum products, up 13,513 carloads or 25.9%; chemicals, up 2,630 carloads or 1.6%; and nonmetallic minerals, up 2,534 carloads or 12.4%. Among the commodities that saw declines were crushed stone, sand and gravel, down 20,358 carloads or 14.6%; grain, down 6,830 carloads or 5.7%; and primary metal products, down 3,117 carloads or 6.4%.

May 2020
While traffic dropped in May 2020 due to the pandemic, John T. Gray said in AAR’s June 3, 2020 traffic report that there were some “heartening” signs. “Overall traffic levels last week [week ending May 30, 2020] were down from the prior week as would be expected for a week which includes a national holiday,” he reported. “However, it is somewhat heartening to note that 11 of the 20 carload categories, including several major commodity areas, improved their showing vs. 2019 when comparing their current loading rates to those we have seen the last four weeks. Perhaps most notably, automobile loadings improved to about one-third the normal level as assembly plants began the intricate process of reopening. While this is still a long way from where we would like to be, it is far better than the 10% of norm of only two weeks ago.”
U.S. railroads originated 740,171 carloads in May 2020, down 27.7%, or 282,965 carloads, from May 2019. U.S. railroads also originated 912,922 containers and trailers in May 2020, down 13%, or 136,241 units, from the same month in 2019. Combined U.S. carload and intermodal originations in May 2020 were 1,653,093, down 20.2%, or 419,206 carloads and intermodal units from May 2019.
In May 2020, one of the 20 carload commodity categories tracked by the AAR each month saw carload gains compared with May 2019. It was farm products excluding grain, up 324 carloads or 10.6%. Commodities that saw declines in May 2020 from May 2019 were commodities such as coal, down 127,201 carloads or 40.7%; motor vehicles and parts, down 49,341 carloads or 75%; and crushed stone, sand and gravel, down 18,196 carloads or 19.4%.
May 2021
U.S. rail volumes for May 2021 were “encouraging,” he noted. Of the 20 carload categories AAR tracks each month, 12 had gains over May 2019 and 18 had gains over May 2020, near the start of the pandemic. Those 18 included coal, up 77,228 carloads or 41.7%; motor vehicles and parts, up 34,021 carloads or 206.5%; and chemicals, up 23,368 carloads or 20.8%.
“Railroads hope to build on these gains in the months ahead as they help the economy return to strong, sustainable growth,” Gray said.
Commodities that saw declines in May 2021 from May 2020 included farm products excluding grain, down 166 carloads or 4.9%; and primary forest products, down 67 carloads or 1.7%.
U.S. railroads originated 964,356 carloads in May 2021, rising 30.4%, or 224,623 carloads, from May 2020, while they originated 1,151,824 containers and trailers, increasing 26.2%, or 238,927 units. Combined, May 2021’s originations came in at 2,116,180, up 28%, or 463,550 carloads and intermodal units from May 2020.
May 2022
“Rail traffic volumes in May [2022] reflected an economy that is a mixture of good and not-so-good,” John T. Gray reported June 1, 2022. “Auto production and auto carloads seem to be slowly recovering; crushed stone and sand, and food-related volumes are showing strength while intermodal had its best month since June 2021. On the other hand, carloads of chemicals fell for the first time in more than a year in May, while grain volumes continued to be disappointing when compared to those of 2021 and the latter half of 2020.”
In May 2022, seven of the 20 carload commodity categories tracked by the association each month saw carload gains compared with May 2021. These included crushed stone, sand and gravel, up 4,659 carloads or 5.8%; motor vehicles and parts, up 4,534 carloads or 9%; and food products, up 1,652 carloads or 7.1%. Commodities that saw declines included grain, down 13,738 carloads or 13.5%; primary metal products, down 5,878 carloads or 15.3%; and petroleum and petroleum products, down 5,857 carloads or 13.5%.
U.S. railroads originated 928,742 carloads in May 2022, falling 3.7%, or 35,821 carloads, from May 2021. They also originated 1,102,558 containers and trailers, decreasing 4.3%, or 49,258 units, from May 2021. Combined U.S. carload and intermodal originations in May 2022 were 2,031,300, down 4%, or 85,079 carloads and intermodal units from 2021.
Year to Date 2023
For the first five months of 2023, total U.S. carload traffic was 4,938,897 carloads, up 0.7%, or 33,332 carloads, from the same period last year; and intermodal volume was 5,124,695 containers and trailers, down 10.9%, or 624,181 units, from 2022.
Total combined U.S. traffic for the first 22 weeks of 2023 was 10,063,592 carloads and intermodal units, a 5.5% fall-off from last year.

Week Ending June 3, 2023
Total U.S. weekly rail traffic came in at 439,601 carloads and intermodal units for the week ending June 3, 2023. This was down 5.7% compared with the same week last year, according to AAR. Class I railroads hauled 219,289 carloads, up 0.4% from the same week in 2022, and 220,312 containers and trailers, down 11.1% from 2022.
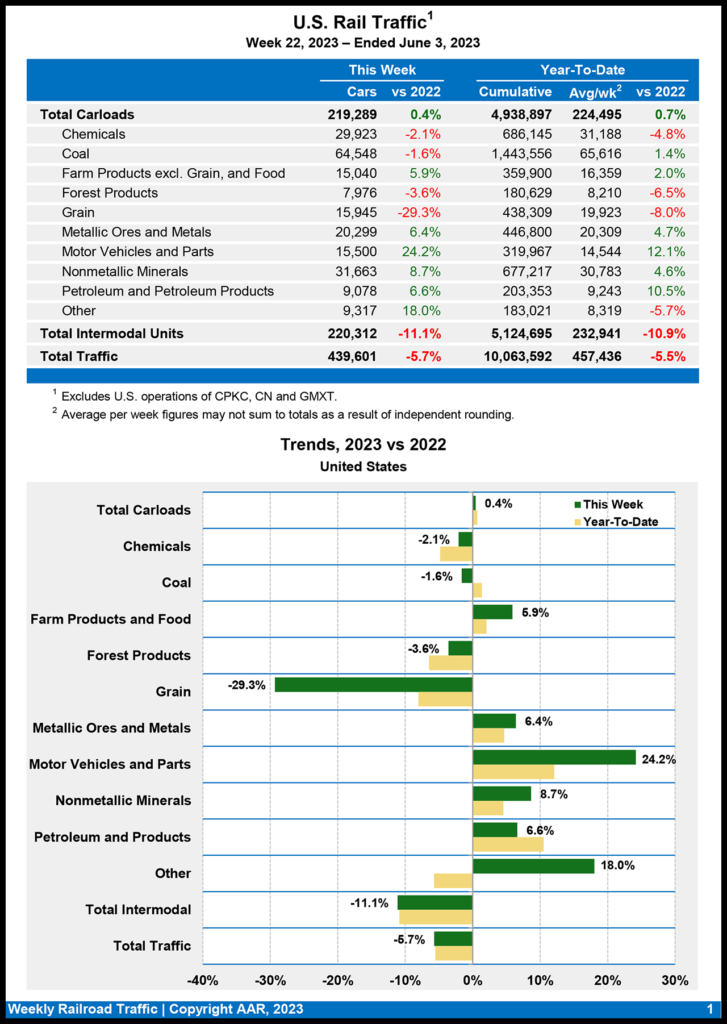
Six of the 10 carload commodity groups posted an increase compared with the same week in 2022. They included motor vehicles and parts, up 3,017 carloads, to 15,500; nonmetallic minerals, up 2,522 carloads, to 31,663; and miscellaneous carloads, up 1,423 carloads, to 9,317. Commodity groups that registered decreases included grain, down 6,615 carloads, to 15,945; coal, down 1,077 carloads, to 64,548; and chemicals, down 635 carloads, to 29,923.
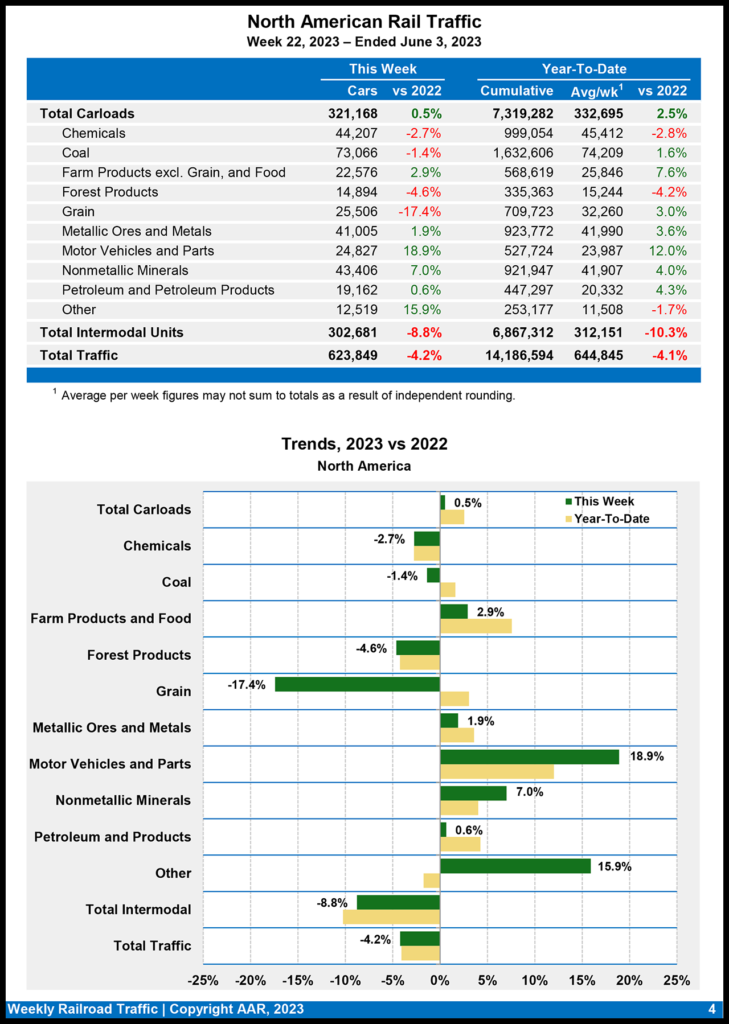
North American rail volume for the week ending June 3, 2023, on 10 reporting U.S., Canadian and Mexican railroads totaled 321,168 carloads, up 0.5% from the same week last year, and 302,681 intermodal units, down 8.8% from 2022. Total combined weekly rail traffic in North America was 623,849 carloads and intermodal units, dipping 4.2%. North American rail volume for the first 22 weeks of 2023 was 14,186,594 carloads and intermodal units, decreasing 4.1% compared with 2022.
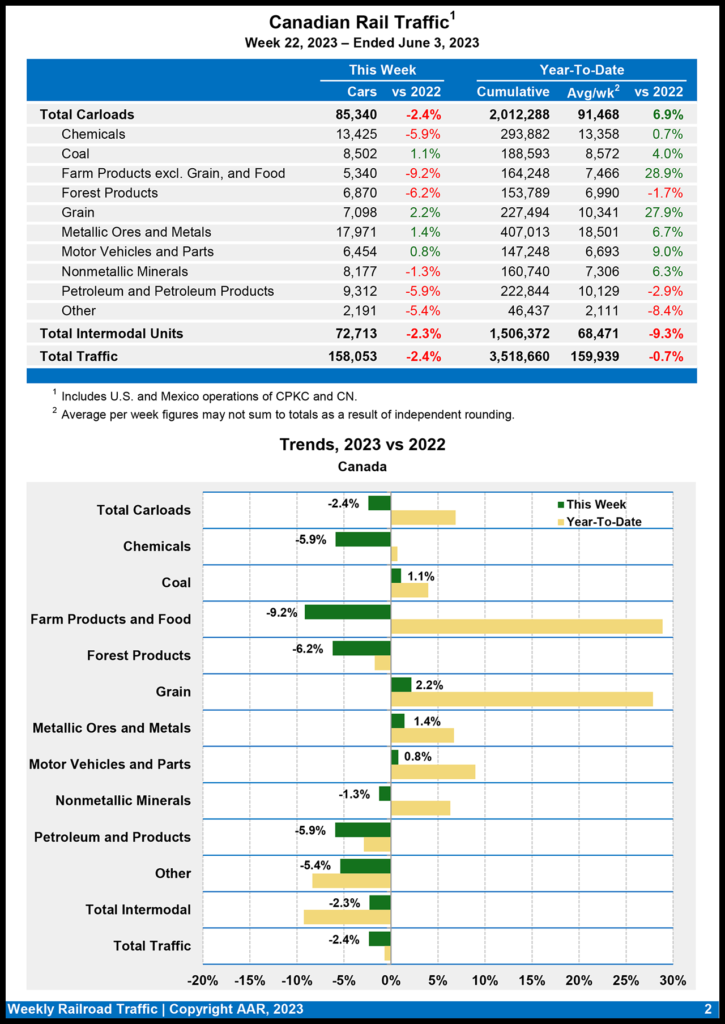
Canadian railroads reported 85,340 carloads for the week ending June 3, 2023, a 2.4% drop-off, and 72,713 intermodal units, a 2.3% decline compared with the same point last year. For the first 22 weeks of 2023, they reported cumulative rail traffic volume of 3,518,660 carloads, containers and trailers, down 0.7%.
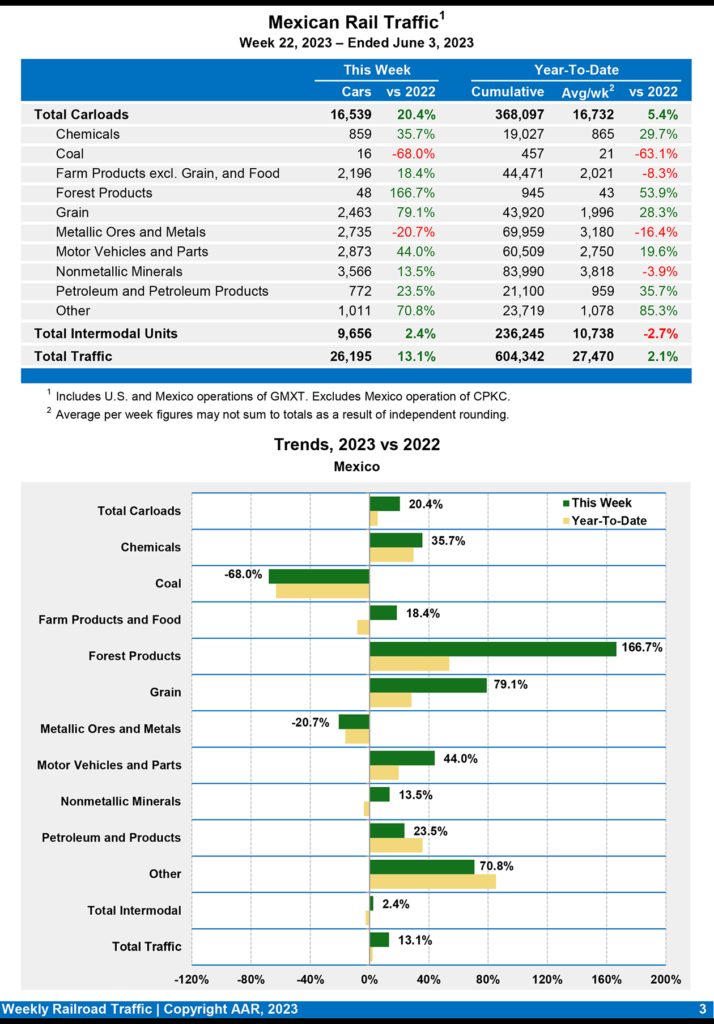
Mexican railroads reported 16,539 carloads for the week ending June 3, 2023, rising 20.4% from prior-year period, and 9,656 intermodal units, increasing 2.4%. Their cumulative volume for the first 22 weeks of this year was 604,342 carloads and intermodal containers and trailers, up 2.1% from 2022.