Commentary
STB’s Annual Rail Rate Index Study: A Deeper Dive
Written by Jay Roman
Image courtesy CIT Rail
The newly released STB Annual Rail Rate Index Study (Study) summarizes trends in freight rail rates between 1985 and 2019. The Study shows that inflation-adjusted Real Rail Rates have decreased 27% over the past 34 years. Because Real rail rates are lower now than in 1985, the STB Study may be read by some to imply that current rail rates are reasonable in relation to what they have been historically. Unfortunately, this is not an accurate conclusion, because the historical trend in rates provides an incomplete picture of the change in cost of shipping freight by rail.
There are numerous problems associated with using a basic Revenue Per Revenue Ton-Mile Rate Trend Analysis to determine the change in cost of shipping by rail over a large number of years. Some of the major problems the Study does not address that deflate the historical rate trend in the Study are:
- The ownership of freight cars has changed substantially.
- The substantial increase in the average distance movements traveled.
- The large amount of rail revenue collected from demurrage and other miscellaneous charges.
In addition to these issues, the impact of big changes in the composition of traffic that moves by rail appears to be only partly addressed in the Study.
The top two issues are addressed in this response as they have the biggest deflation impact on the historical trends in the Study.
Freight Car Ownership Has Changed
A big problem with tracking rail rate trends over a long period of time is that what is included in rail rates has changed dramatically over time. Illustration 1 shows the magnitude of the change in railcar ownership:
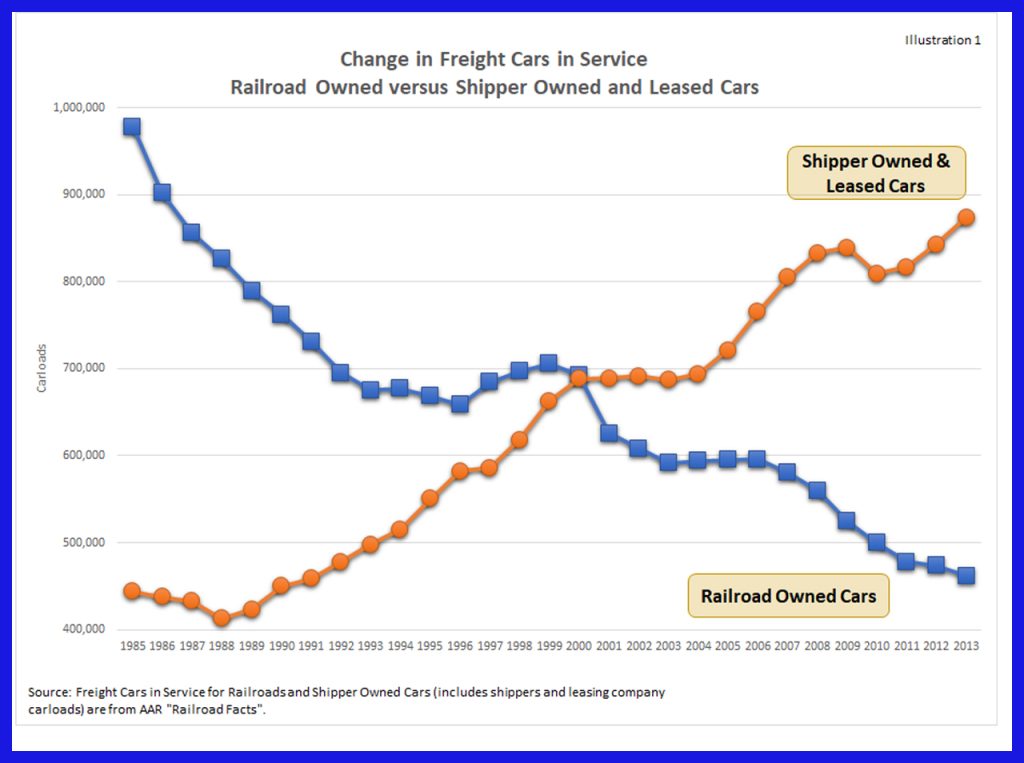
There has been a complete reversal as to who owns the freight cars that move rail traffic. In 1985, railroads owned the majority of freight cars. By 2013, there was a complete reversal, as rail shippers and leasing companies owned most of the railcars. The STB Study does not take into account the change in car ownership when analyzing the historical change in rates. (The graph ends in 2013 as that was the last year that railroads provided an ownership breakdown of freight cars in service.)
In the 1985 base year of the Study, railroads owned most of the railcars, so the cost of the car was included in the railroad’s freight rate. Now, rail shippers and the companies that lease cars to shippers own most of the railcars. The cost of car ownership is therefore no longer included in the rate for most movements. This reduced the railroads’ expense for moving traffic as well as shippers’ rail rates. Shippers’ costs for moving freight did not, however, decrease, because shippers absorbed the cost of the freight car directly and not through the rail rate.
The dramatic change in who owns railcars distorts the results of a basic Rate Trend Study. Railroad rates and expenses are both reduced by the change in car ownership, and both need to be considered in determining whether current rail rates are reasonable in relation to what they have been historically.
Longer Distance Moves Have Lower Rates on a Revenue Per Ton-Mile Basis
Rail rates in the Study are calculated based on Revenue Per Ton-Mile (RPTM) for movements. This puts downward pressure on the Study’s rates because the average distance for rail movements increased from 665 miles to 1,032 miles, representing a 55% increase between 1985 and 2019. The increase in the average distance per movement deflates rate changes in the Study.
An RPTM calculation divides rates by the total Revenue Ton-Miles (RTMs) for movements. This calculation works well when there is not a big change in the distance for movements. However, when movements travel a much longer distance, rates on a ton-mile basis normally decrease substantially. This is because all costs included in rates don’t increase with the distance for movements. As an example, the cost of picking up a car at an origin and dropping it off at a destination is the same if the distance for the move is 200 miles or 2,000 miles. However, by dividing the rate by the ton-miles for a movement, you assume that these types of costs, which are covered in the rate, increase with distance. Rates normally increase less than ton-miles and this causes rates on a ton-mile basis to decrease on longer-distance moves.
For this reason, RPTM rates for a 665-mile move (average miles for rail moves in the 1985 base year of the Study) will almost always be greater than the RPTM for a 1,032-mile move (average miles for rail moves in 2019), a 55% increase.
The Rate Trend Study does not consider the impact of the 55% increase in the average length of haul for moves. Therefore, much of what is shown in the Study as a decrease in Real Rail Rates just reflects the change in the composition of rates between 1985 and 2019.
It needs to be understood that a per-ton-mile calculation will generate similar downward pressure on both rates and rail expenses. By not considering the impact of using a per-ton-mile calculation on both expenses and revenue, one only gets the half of the picture that supports the position that rates are reasonable. When both cost and rates are considered, the picture is very different.
One can eliminate the mileage problem with RPTM calculations by comparing the difference between revenue and expense over time. (This difference is shown below in Illustration 3.)
A Different Picture of Rate Trends
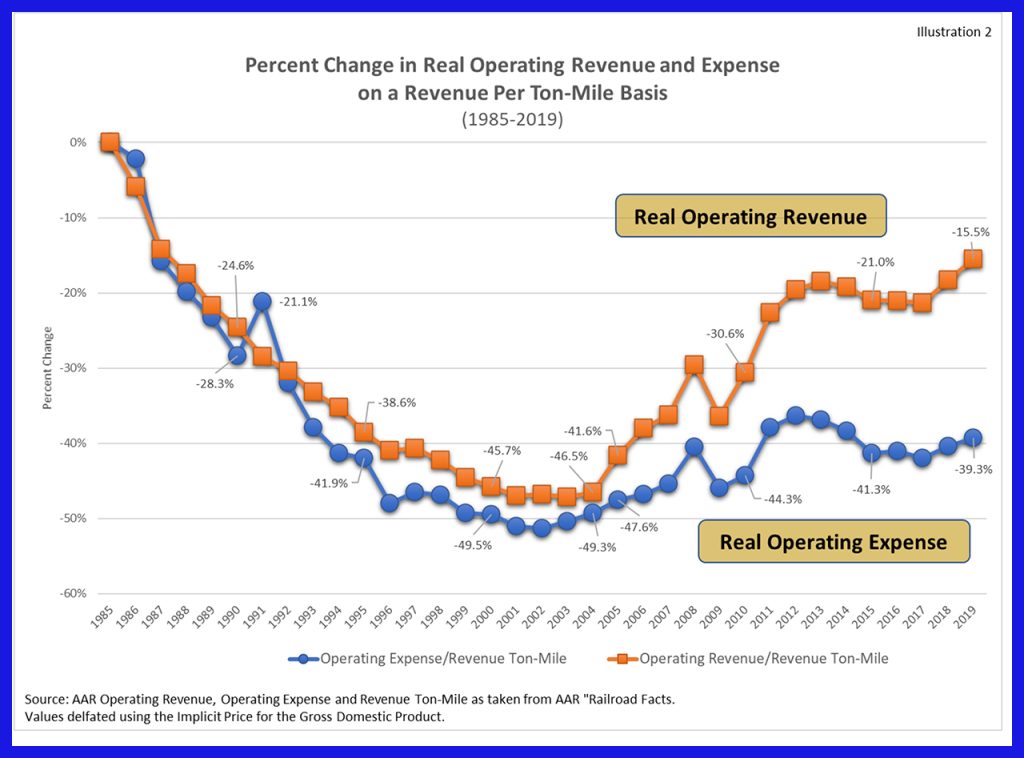
To provide a more complete story of rate changes, it is good to look at the trend in railroad expenses in relation to rail revenue. Illustration 2 uses Association of American Railroads (AAR) data to make this comparison for the years 1985 through 2019.
Illustration 2 provides a different picture of the trend in rail rates. It shows that between 1985 and 2004, the change in Real Rail Revenue was very similar to the change in Real Rail Expenses, because they both decreased around 50%. After 2004, the rate premium above expenses grew significantly, as Real Rail RPTMs increased 58% compared to 2004 while Real Expense increased only 20%.
Illustration 2 shows that Real RPTM in 2019 was still 15% below 1985 levels, but this change is deflated as it:
- Does not include the cost of car ownership for most rates in 2019, while car ownership costs were included in most rates in 1985.
- Does not consider that Real Rail rates are deflated due to the 55% increase in the average haul for movements between 1985 and 2019.
Correcting these problems would cause the change in rates to increase well above their level in 1985. Illustration 3 provides a more accurate picture of current problems with rail rates as it eliminates the problem inherent in using an RPTM calculation in a Trend Analysis. Expenses and Revenue are both impacted to the same degree by the 55% increase in the distance for movements in Illustration 3.
Illustration 3 also shows that, between 1985 and 2004, the Premium Above Expenses changed roughly proportionately with the rate of inflation. The Premium Above Expenses primarily increased with inflation, which resulted in no cumulative change in real terms:
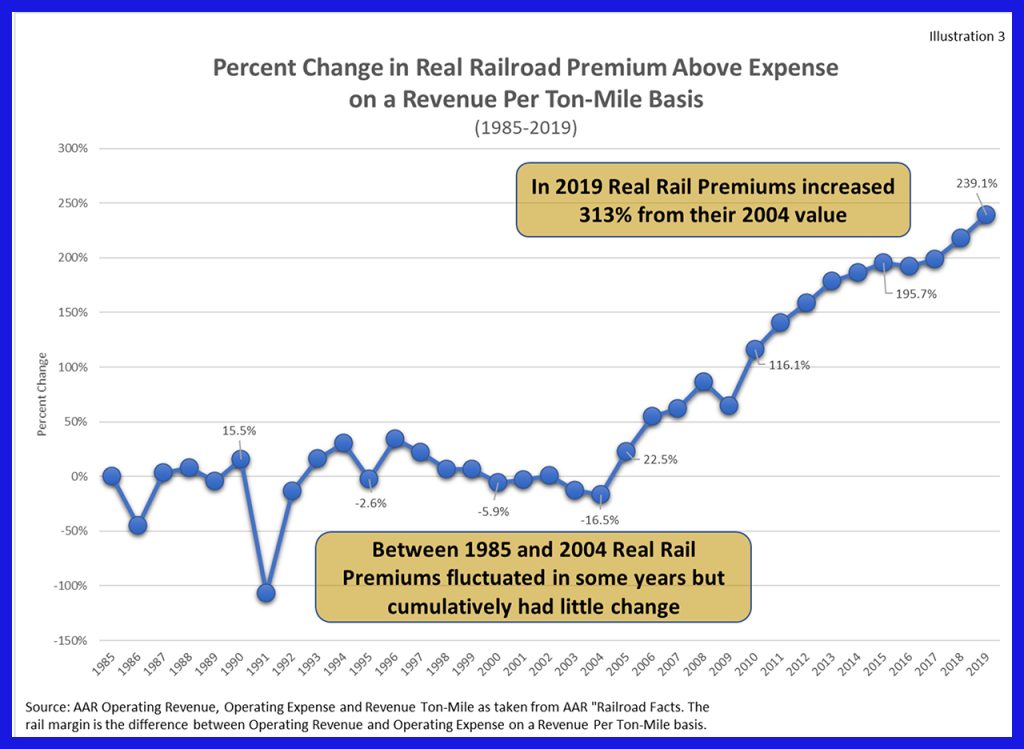
After 2004, Real Premium Above Expenses increased 313% from where it was in 2004. In real terms, the Premium Above Expenses is 239% higher than where it was in 1985. These are very large increases that indicate railroads have improved their ability to obtain large rate increases from shippers. The large increase in this Premium represents a big success story for railroads not reflected in the STB Rail Rate Trend Study.
From a shipper’s perspective, the large increase in the Premium Above Expenses after 2004 is causing big problems. This is resulting in railroads having a much larger percentage of their revenue coming from movements with Revenue to Variable Cost Ratios (RVCs) greater than the STB Jurisdictional Threshold of 180%. For example, a recent rate study of eight major commodity groups Escalation Consultants performed for the Rail Customer Coalition showed that rail moves with RVCs above 180% have become the norm and are no longer the exception, as 50% of all railroad revenue was generated by high RVC moves. This was up from 27% of all revenue in 2004.
The railroads’ large rate increases have made the Premium Above Rail Expenses higher than it has ever been before. This supports the need for new STB rate regulations that level the playing field for shippers’ chance of succeeding in a rate challenge. These types of revised regulations are sorely needed, as they would increase shippers’ chance for success in a rate challenge before the STB. This would then increase shipper’s negotiation leverage for obtaining rates with a more reasonable premium above a railroad’s expenses.
Jay Roman is President of Escalation Consultants, Inc. Since founding Escalation Consultants in 1979, he has assisted hundreds of companies in reducing rail expenses to help increase market share and profitability and is annually involved with more than a billion dollars in rail spend with shippers. Mr. Roman has testified as an expert on pricing issues involving coal and rail transportation issues before the Federal Energy Regulatory Commission, in federal and state courts, before the National Energy Board of Canada, in arbitrations in the U.S. and Canada as well as before the Surface Transportation Board. He is the owner and developer of the Rail Cost Control Program which is used by a large number of shippers to help obtain reasonable rates for their traffic. Thousands of rail transportation executives have attended Mr. Roman’s programs on controlling rail expenses. Escalation Consultants’ next Rail Negotiation Seminar is being held on May 4th and 5th in Tampa, Fla. Click below to register: