Commentary
2020 Dispatching, A Short Story
Written by Steve Ditmeyer, Principal, Transportation Technology and Economics
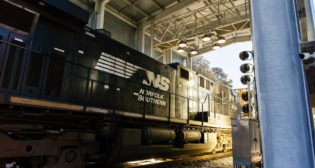
Photo courtesy Norfolk Southern
The following is a fictional account written in the Year 2000 predicting what train dispatching might or could have been like 20 years later. It was published as a sidebar in the Federal Railroad Administration’s “Five-Year Strategic Plan for Railroad Research, Development, and Demonstrations,” March 2002. I was, in retrospect, excessively optimistic about how train dispatching would change over two decades. Perhaps the title of the story should be changed to “2050 Dispatching”?
What will railroad dispatching be like two decades from now? This sketch offers one possible answer, in the words of a Great Western & Pacific dispatcher showing off his workstation to an authorized visitor.
“Ready. Hancock. Railhawk. Six-seven-four-one. Dispatch Woodbridge. Date six-ten-thirty. Time zero-seven-zero-three. Cover TS one-seven-one and TS one-seven-five. Request display. Over.”
“Come on in. Sorry for ignoring you. Have a seat there. I was just saying good morning to the system and setting up my territory. Now that I’ve signed on, I’ll show you how things work. Watch over here—the wall will light up in a second. There we go. Rather impressive, huh? Dispatching at the GW&P has come a long way from the days of CTC and PTC.
“The system’s in a display mode right now. When I talked to the machine a minute ago, I told it who I was, where I was, the date and time, and what track segments I need. Then I asked for display mode. That means we can look at the trains on the wall displays, but we can’t talk to them or get live camera closeups or change their speeds or redo the traffic plan. All that comes in the control mode, which I can’t get to right now because Campbell is still on duty. If I had asked for control mode when I signed on, the machine would have scolded me.
“See the window at the top left? The system is asking me for an on-duty acknowledgment—an important detail, since that’s how I get paid. I’ll ignore it for now, because I can’t really be a dispatcher and a tour guide at the same time. There’s twenty minutes or so before I need to go on duty—that should be plenty of time to walk you through the basics.
“What you see on the wall are all the default displays for my workstation—the ones I’ve selected for my user profile. They’re the displays I’m most likely to need most of the time. Of course I need other displays at times, but they’re easy to get to—I’ll show you how that works in a little bit. The map to the left shows the territory I’m responsible for—at least for right now. They can split things up just about any way they want, so when traffic is lighter—like at night—fewer dispatchers can carry the load by each taking a bigger piece.
“This is an overview. It shows the whole territory, but not in great detail. You do see all the trains and vehicles, thanks to the data link and the new GPS III satellites. We’re running the trains close together today. We usually do these days, with trucking on the decline and rail traffic way up. It’s kind of scary, when you realize the trains are moving at 140 kilometers an hour and some of them are just two or three kilometers apart. No problem, really. The system always knows what’s safe and what’s not. It has a good pedigree—we haven’t had a collision for years now.
“Look closely and you’ll see the trains moving along the track. What we see here is what’s happening in the field—right now, 800 miles away. Look, 7940 east just stopped on the main. The flashing train symbol tells us he’s stopped, and you can see the symbol is staying in one place now. The purple bar shows that he’s at the edge of maintenance-of-way territory. He’s waiting for clearance from the gang foreman there. We’ll see a green bar along the track when he gets his authority to go. If that train weren’t authorized to stop, we’d get a message and an audible alarm. As it is, we’d get the alarm if the train didn’t stop—and so would he. Onboard enforcement would put the brakes on. Train movements are pretty closely controlled these days.
“The next screen over is a control view of Falls City to Jones Junction. Since the territory is more blown up, the train movements are more obvious on this one. Looks like they’re really moving along. And you can see the switches. Most of the switches are powered now, and the manual ones are at least monitored. This view shows the actual switch alignments in the field. If we watch closely, we might catch a switch in the act of realignment. At just the right time, Central Control gives the word, the switch obeys, and I see it on the display. It’s all very neat. There are no maintained signals left on this stretch, but if there were, we’d see them here too, with their aspects.
“Let me put the headset on, and I’ll show you a couple ways I talk with the system. It’s cordless, you see. The keyboard’s the same way. I’m not tied to one position this way. It’s kind of nice to be able to lean back in my chair with the keyboard on my lap and not worry about coming unplugged. Most of my communication is data link, so the headset is really optional. I can set it to monitor all of the incoming voice channels—phone and radio both—but even then there’s not a big communication load. I’ll average one conversation every ten or fifteen minutes—that’s on a day of heavy traffic. I talk to the machine more often than that. In the old old days, before PTC arrived on the scene, they tell me I’d have been on a voice channel fifty minutes out of every hour. Is that dispatching?
“What I like the headset for is its inertia sensors. Here’s how they work. Look at the cursor on the wall display—right now it’s over the on-duty time in the top left window. I activate the sensors with this button, and now my head movements direct the cursor- head to the right, cursor to the right; head downward, cursor downward, and so forth. Same idea as the old PTC trackball, only now the trackball is my head. The cursor jumps freely between displays. Once I get it where I want it on any of the four displays, I press SELECT on the keyboard, and I’ve made my will known to the machine.
“Let’s say I want to look at the control view of a different track segment—some people still say ‘planning line,’ which is old PTC terminology. I nod the cursor into place over the CONTROL function-there at the bottom of the Falls City-to-Jones Junction map—and press SELECT. There’s our list of track segments to choose from. Suppose we want Glen Springs to Snowden. Position the cursor, press SELECT, and there we have it—a new control area. Not a lot of traffic on this one, you can see.
“I’ll show you another way of doing the same thing. Good for variety. The keyboard has a key for map selection the second function key at the top here. When I press it, I’m telling the machine I want to chose another control area for display. The machine at that point is all ears—it’s just waiting to hear which area I want. I can tell it with my head, by moving the cursor in place over the area I want on the overview map. Or I can tell it with my voice, like this: ‘TS one-seven-four. Over.’ Saying ‘Over’ is the same as pressing SELECT. And there we have it Glen Springs to Snowden. Quick, isn’t it?
“Let’s look at the weather map. Watch what happens to the overview map when I press the last function key on the right here. There it is a weather overlay. The blue and black digital readings at stations are temperatures. Mostly blue—it’s a cold morning in Wyoming. Blue is cold, red is hot, black is in between. I forget what the exact distinctions are. But the icons tell the real story. Notice the broken thermometer at Snowden, with 51 degrees in black and 11 degrees in blue. That shows there’s been a 40-degree dip over the last twenty-four hours or less. That kind of swing can spell trouble for rails. You can be sure the track inspector out there has his eyes open.
“Further west, you can see snow falling at Circle, and some pretty stiff winds at Jones Junction. That icon is oriented to show the wind direction, and the numbers next to it are kilometers per hour—the 73 on top is the maximum wind velocity over the last two hours, and the 47—well, 51 now—that’s the current velocity. It’s all real‑time stuff, you see. With this kind of weather reporting, we can almost predict when we’re going to hear from some engineer worried about maintaining his pacing speed. But of course, Central Control is always one step ahead. The pacing speeds reflect what’s happening with the weather.
“I’m going to switch the weather off. Some dispatchers keep the weather overlay up all the time—build it into their user profile—but for me it makes the map a little too cluttered. I’ll look at it every hour or so. Besides, if the system detects a severe condition—heavy snow, high winds, big temperature swing, or whatever—I’ll get an advisory. The way things are set up, it’s hard for us to miss anything really important.
“We haven’t looked at the traffic plan yet. It’s probably the most important thing on the wall there. The maps we’ve been looking at show where everything is, how close together the trains are running, whether they’re moving, and so on. But they don’t show how well the traffic is keeping up with the plan. To get that, I need to look at the planning graph. The idea is ancient. PTC had something similar, and back before that dispatchers sometimes played with stringlines on paper charts to try and picture the traffic flow. Quite simple, but the basic idea is sound. Our enhanced version shows all the trains on any given track segment. I tell the system which segment I want and how far into the future I want to look. I’ve set my default value at four hours.
“Moving up the graph, we’re moving ahead in time. Moving from left to right, we’re going west to east. Right now you can see a dozen or so trains running between Glen Springs and Nichols Wye. A run line that’s not vertical shows a train that’s moving. Here’s a vertical one—eastbound 7802 is sitting in the siding at Hathaway, waiting for two westbounds to pass. The first one is Amtrak, and the second is a hotshot intermodal. They’re flying. The faster the train, the less the slope on the graph.
“This solid black line divides the past from the future. Below it, we’re looking at history—the run lines show exactly where each train was at any time over the last hour. We can go back further than that, but it’s not real useful information—more for the archives. Above the black line, we’re looking at the future—the traffic plan currently in effect. Ideally, the history segment of each run line flows right into the future segment at the black line, which represents the present. That means that right now, the train is keeping pace with the plan. That’s the case with all but two of our trains here—not a bad batting average for this corridor. We’ve got two eastbounds a little behind schedule. You can see their run lines are yellow instead of green, and the past and future segments don’t quite connect at the present. If they were in serious trouble, their run lines would turn red. I expect they’ll both make up the lost time before they reach Glen Springs—we’re only talking about minutes.
“We don’t see a lot of red lines on the planning graph any more. When we do see one, chances are we’ll need to talk with the crew to find out what’s happening. Half the time, they’ll call us first. Their display tells them when they’re slipping on the schedule, and usually it tells them why. Things can get interesting then. The trick always is to minimize the damage. It may mean pulling the train off the main so everybody else can keep on schedule. Sometimes we may not have the siding to do that. Or if it’s a hot cargo, we may handle it differently. I’ll ask Central Control for a new plan—that’s what the REPLAN function is for – and it will sort through the options and propose what it thinks is the best one, all things considered. Usually I’ll agree with what the system comes up with—nowadays it knows practically everything. But I still have the final say.
“Speaking of the final say, I’d better stop talking. I’m just three minutes away from my shift. Time to report on duty. Highlight the current time. SELECT. There, that’s more like it—now I’m getting paid for my time. Next thing is to put my workstation on standby to receive active control. To do that, I talk to the machine again.”
“Hancock. Railhawk. Request standby control. Over.”
“There. You can see the machine understood. Now Campbell knows I’m here, ready to go. She was probably beginning to wonder. Working at home like this, there aren’t many excuses left for being late to the job.
“The instant Campbell signs off, I’m on. You can stay and watch if you like. Before long, I’ll probably be looking at some live camera closeups from lead units and hirails. We’ll see with our own eyes how heavy it’s snowing up there. With those weather conditions, we may get some red run lines this morning. That’s when the system really shows its stuff.”
This story is indebted conceptually to a fictional description of a possible interface between air traffic controllers and the ATC system of the future in “The Controller/System Interface,” by H. David, published by the Eurocontrol Experimental Centre, Bretigny‑sur‑Orge, France, May 1986. John Vanderhorst of the Applied Communications Group assisted in writing this story.